> For the complete documentation index, see [llms.txt](https://docs.uptiq.ai/llms.txt). Markdown versions of documentation pages are available by appending `.md` to page URLs; this page is available as [Markdown](https://docs.uptiq.ai/control-center/observe/runs-and-traces.md).

# Runs & Traces

Inspect agent executions, trace decisions, and diagnose performance issues quickly.

Runs & Traces records every agent and app execution in your account. It captures LLM calls, tool calls, guardrails, inputs, and outputs at each step.

Use it to inspect an execution as an ordered trace, a dependency graph, or a plain-language summary. It is read-only. You cannot rerun or edit executions here.

> Find Runs & Traces in **Control Center → Observability → Runs & Traces**.

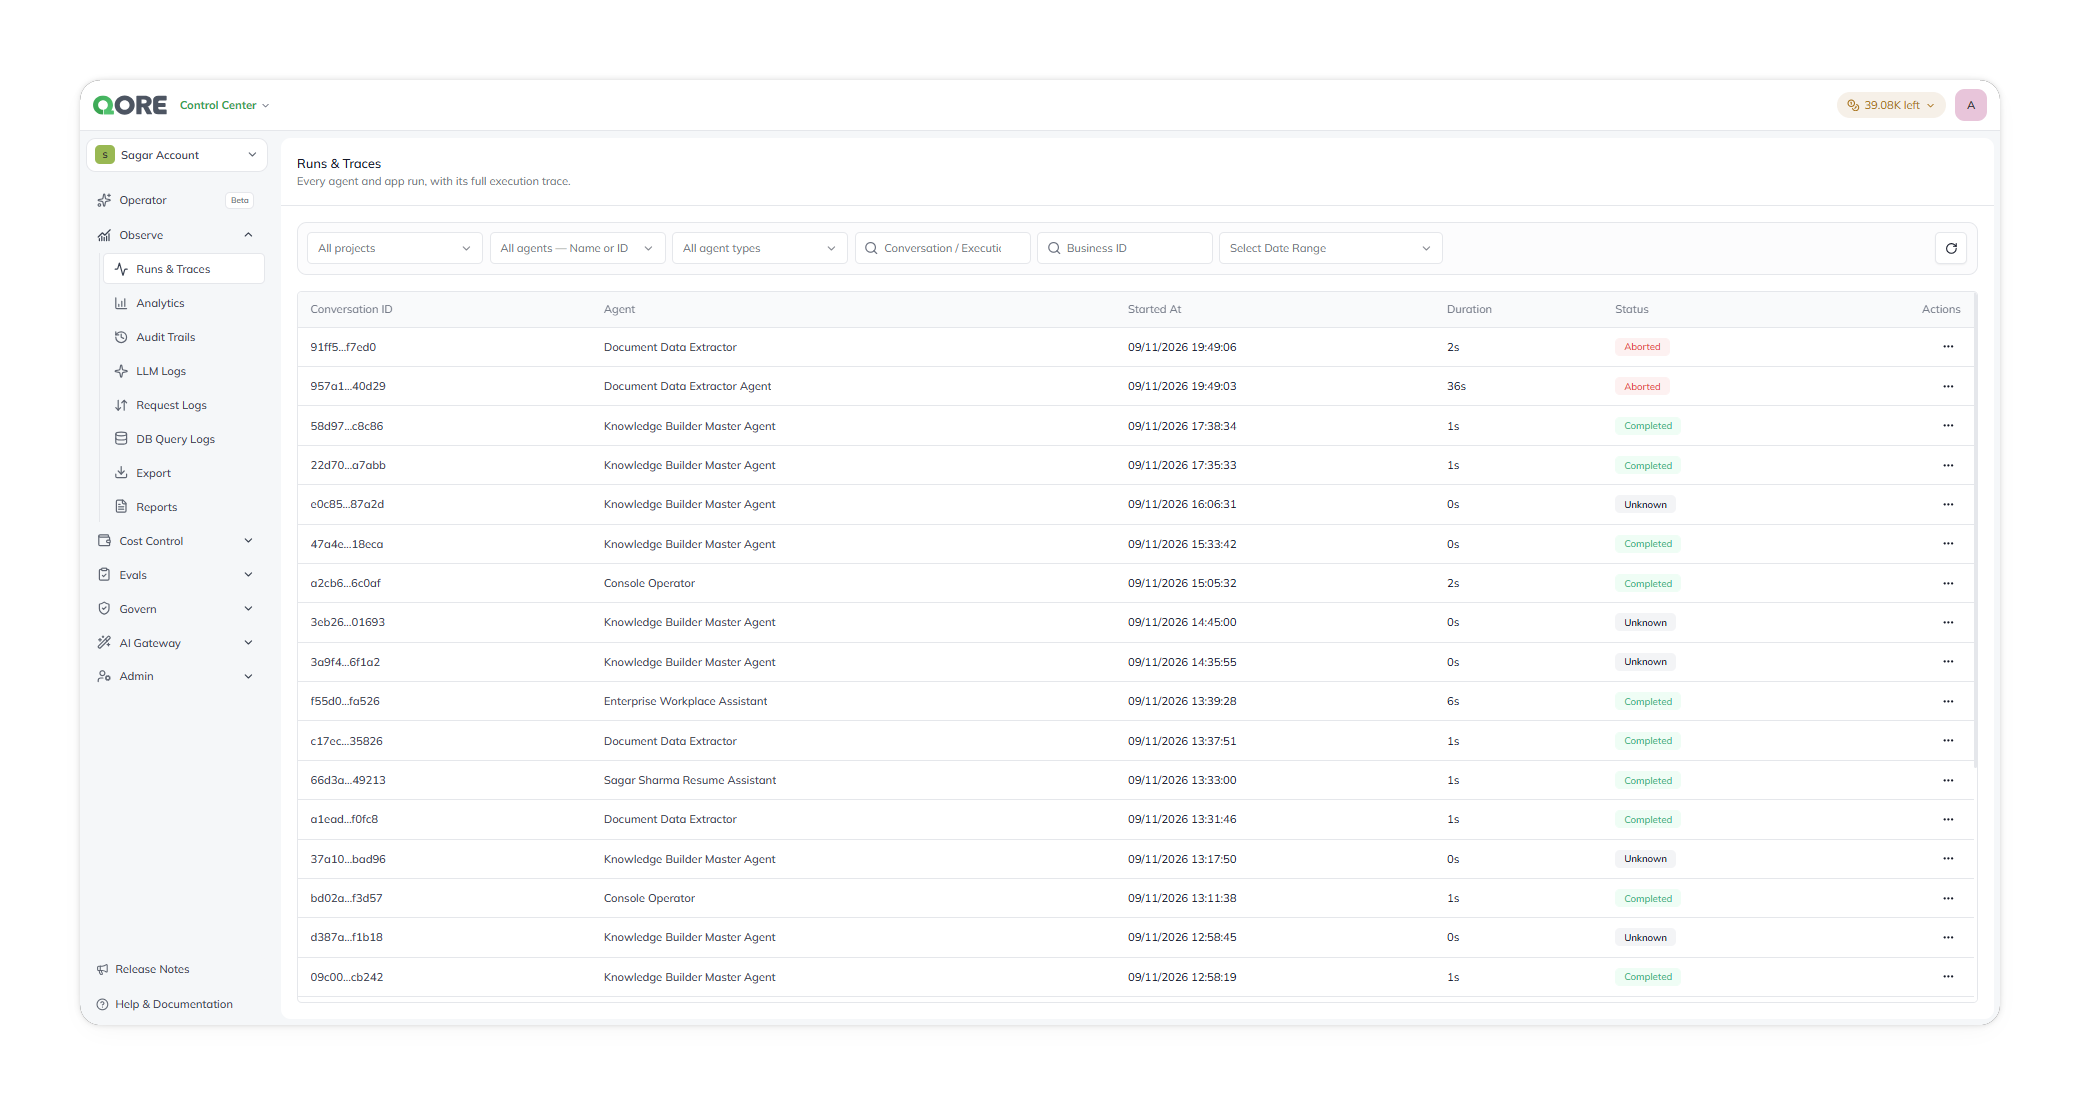
<figure><img src="https://1326225582-files.gitbook.io/~/files/v0/b/gitbook-x-prod.appspot.com/o/spaces%2F0qmgQjJ5aArDTj2ACFHG%2Fuploads%2Fgit-blob-5a424b19f2d9168151d2ce2504a66bb53c7ffd32%2Fqore_control-center_control-centre-observability-runs-traces_rounded_shadow.png?alt=media" alt="The Runs &#x26; Traces screen, listing executions with Conversation ID, Agent, Started At, Duration, and Status columns"><figcaption><p>Runs &#x26; Traces, listing every agent and app execution.</p></figcaption></figure>

## Concepts

Use these terms when investigating an execution.

| Term       | Meaning                                       | Use it to                                                                     | Important detail                                               |
| ---------- | --------------------------------------------- | ----------------------------------------------------------------------------- | -------------------------------------------------------------- |
| **Run**    | One agent or app execution.                   | Investigate work triggered by an API call, schedule, or session.              | A run can produce a trace.                                     |
| **Thread** | The conversation or session containing a run. | Follow a multi-turn conversation.                                             | A thread can contain several runs.                             |
| **Trace**  | The ordered record of one run.                | Understand what happened during execution.                                    | It is reconstructed from execution logs.                       |
| **Span**   | One trace step.                               | Isolate an LLM call, tool call, guardrail check, planning step, or retrieval. | It has a name and duration. Token use appears when applicable. |

Each span has a `name` and `category`. Names include `LlmGeneration`, `DecideOptimalStrategy`, and `PIIMaskingDetokenize`. Categories include Run, LLM, Tool, Retrieval, Reasoning, Guardrail, and Privacy.

## Find an execution

Runs are scoped to your current account, and can be narrowed to one project. Results appear newest first, with 10 threads on each page.

Open a thread to inspect its traces. IDs may appear shortened for readability. Point to an ID to reveal the full value. Copy the full trace ID from its details when needed.

Refine the results with one or more criteria. Criteria combine with `AND`. A project, agent, and date range return only matching runs.

| Search criterion       | Matches                               | Best for                                 | Example                            |
| ---------------------- | ------------------------------------- | ---------------------------------------- | ---------------------------------- |
| Project                | Runs from one project.                | Investigating a project-specific issue.  | A production project.              |
| Agent name or ID       | Runs from one agent.                  | Triaging one agent.                      | An agent display name.             |
| Thread or execution ID | One run by its full identifier.       | Investigating a reported execution.      | An ID from an API response or log. |
| Business ID            | Runs linked to a business identifier. | Matching executions to an app record.    | A customer or case identifier.     |
| Date range             | Runs by start time.                   | Narrowing an incident, release, or week. | A defined time window.             |

Refresh results without changing the URL. Use this when a `Waiting` run may have progressed.

## Inspect a trace

{% stepper %}
{% step %}

### Open the thread

Open a thread to view its agent name, full thread ID, and traces. Each trace includes its opening prompt, ID, start time, duration, and span total.

{% hint style="info" %}
`No traces to display` means the logs could not reconstruct spans. This is normal for short, aborted, or incompletely logged runs. It does not mean the run failed.
{% endhint %}
{% endstep %}

{% step %}

### Open the trace

Open a trace to inspect its details. Return to the thread’s trace list when needed. Copy the full trace ID into a ticket, log query, or API call.
{% endstep %}
{% endstepper %}

{% tabs %}
{% tab title="Trace" %}
Review spans in execution order with their input and output. Use this view to see what each step received and returned.

Each span provides its name, duration, and token use when applicable. Open a span to examine its name, timestamp, duration, input, and output as JSON.

LLM spans also report the model, provider, input tokens, output tokens, credits, and USD cost. The root `Agent run` input contains the invocation context. Its `agentOptions` includes the mode, inline-evaluation flag, and strategy configuration. Use `executionId`, `triggerMethod`, `agentOptions`, `piiMaskingConfig`, `queueId`, `executorVersion`, `sdkVersion`, and `requestId` to reproduce a run.
{% endtab %}

{% tab title="Graph" %}
Follow parent and child span relationships. Each span shows its category: Run, LLM, Tool, Retrieval, Reasoning, Guardrail, or Privacy. Categories use colored tags.

Use this view when execution order hides the relationship you need. For example, identify which planning step started a downstream LLM call.
{% endtab %}

{% tab title="Summary" %}
Read a plain-language walkthrough with duration, span, and token totals. Each step has a one-sentence description. For example, an `LlmGeneration` span reports that the agent generated a response using a language model.

Use this view for a quick review or a ticket-ready walkthrough.
{% endtab %}
{% endtabs %}

## Interpret span types

Executor span names stay consistent across runs.

| Span name                                      | Category  | Meaning                                                                 | Investigate when                            | Key evidence                                                                                                  |
| ---------------------------------------------- | --------- | ----------------------------------------------------------------------- | ------------------------------------------- | ------------------------------------------------------------------------------------------------------------- |
| `Agent run`                                    | Run       | The root span for the execution.                                        | You need the overall invocation context.    | Its duration is the run total.                                                                                |
| `LlmGeneration`                                | LLM       | One model call.                                                         | A run is slow or costly.                    | Model, provider, tokens, credits, and USD cost. Long calls often dominate duration.                           |
| `DecideOptimalStrategy`                        | Reasoning | The agent chose an approach.                                            | The run took an unexpected path.            | Review its input and output first.                                                                            |
| `Planning`                                     | Reasoning | The agent defined next steps.                                           | You need to trace an agent decision.        | Compare it with `DecideOptimalStrategy`.                                                                      |
| `LearningCaseFetch`                            | Retrieval | The run retrieved a learning case or prior context.                     | Prior context may have affected the result. | Retrieved context.                                                                                            |
| `PIIMaskingTokenize` or `PIIMaskingDetokenize` | Privacy   | Sensitive values were masked before a model call and restored after it. | You need to confirm masking behavior.       | Duration is usually `0 ms`. A `piiMaskingConfig.maskingProvider` value other than `Off` confirms masking ran. |

## Status values

Use status to understand the run’s current state.

* **Completed** — The run finished normally.
* **Waiting** — The run is executing or paused on an external step. This can include an item awaiting [Human Review](/control-center/evals/human-review.md). The status does not distinguish these cases.

{% hint style="warning" %}
`Waiting` does not automatically mean a run is stuck. If it exceeds its usual duration, check Human Review before treating it as a failure. Refresh results to check for progress.
{% endhint %}

## Use execution details

Use the available execution details to:

* Identify the thread ID and agent that produced a run.
* Correlate its local-time start timestamp with an incident or deployment.
* Find long runs from their total duration, such as `20s` or `2m 31s`.
* Open additional actions for an individual thread.

## Related

<table data-view="cards"><thead><tr><th>Resource</th><th>Use it for</th><th data-card-target data-type="content-ref">Open</th></tr></thead><tbody><tr><td>Analytics</td><td>Review run volume, latency, spend, and error rates.</td><td><a href="/control-center/observe/analytics.md">Analytics</a></td></tr><tr><td>LLM Logs</td><td>Review filterable model-call logs outside a trace.</td><td><a href="/control-center/observe/llm-logs.md">LLM Logs</a></td></tr><tr><td>Audit Trails</td><td>Investigate account governance events alongside executions.</td><td><a href="/control-center/observe/audit-trails.md">Audit Trails</a></td></tr><tr><td>Human Review</td><td>Resolve runs paused for a reviewer.</td><td><a href="/control-center/evals/human-review.md">Human Review</a></td></tr><tr><td>Online Eval</td><td>Assess live runs against quality and safety criteria.</td><td><a href="/control-center/evals/online-eval.md">Online Eval</a></td></tr></tbody></table>


---

# Agent Instructions
This documentation is published with GitBook. GitBook is the documentation platform designed so that both humans and AI agents can read, navigate, and reason over technical content effectively. Learn more at gitbook.com.

## Querying This Documentation
If you need additional information that is not directly available in this page, you can query the documentation dynamically by asking a question.

Perform an HTTP GET request on the current page URL with the `ask` query parameter, and the optional `goal` query parameter:

```
GET https://docs.uptiq.ai/control-center/observe/runs-and-traces.md?ask=<question>&goal=<endgoal>
```

`ask` is the immediate question: it should be specific, self-contained, and written in natural language.
`goal` is optional and describes the broader end goal you are ultimately trying to accomplish on behalf of the user. GitBook uses it to tailor the answer towards what is most useful for that goal.

The response will contain a direct answer to the question and relevant excerpts and sources from the documentation.

Use this mechanism when the answer is not explicitly present in the current page, you need clarification or additional context, or you want to retrieve related documentation sections.
