> For the complete documentation index, see [llms.txt](https://docs.uptiq.ai/llms.txt). Markdown versions of documentation pages are available by appending `.md` to page URLs; this page is available as [Markdown](https://docs.uptiq.ai/control-center/observe/analytics.md).
# Analytics
Track app engagement, platform activity, and agent execution outcomes.
See how published apps and agents are used, and how teams build on the platform. Use Analytics to understand adoption, volume, and outcomes before investigating quality or low-level calls.
{% columns %}
{% column %}
#### Understand adoption
Measure published-app engagement and account-wide build activity.
{% endcolumn %}
{% column %}
#### Investigate agent outcomes
Review execution volume, success rate, and per-agent performance.
{% endcolumn %}
{% endcolumns %}
### At a glance
Analytics is one page with three tabs. It's account-wide; you can filter by project, and **Overview**, **Apps**, and **Agents** each support their own date-range filter.
| Tab | Use it to |
| ------------ | ----------------------------------------------------------------------------------------- |
| **Overview** | Track account-wide build activity — users, projects, apps, and agents created and shipped |
| **Apps** | Track end-user engagement with your published apps |
| **Agents** | Review agent execution volume, success rate, and quality |
## Overview
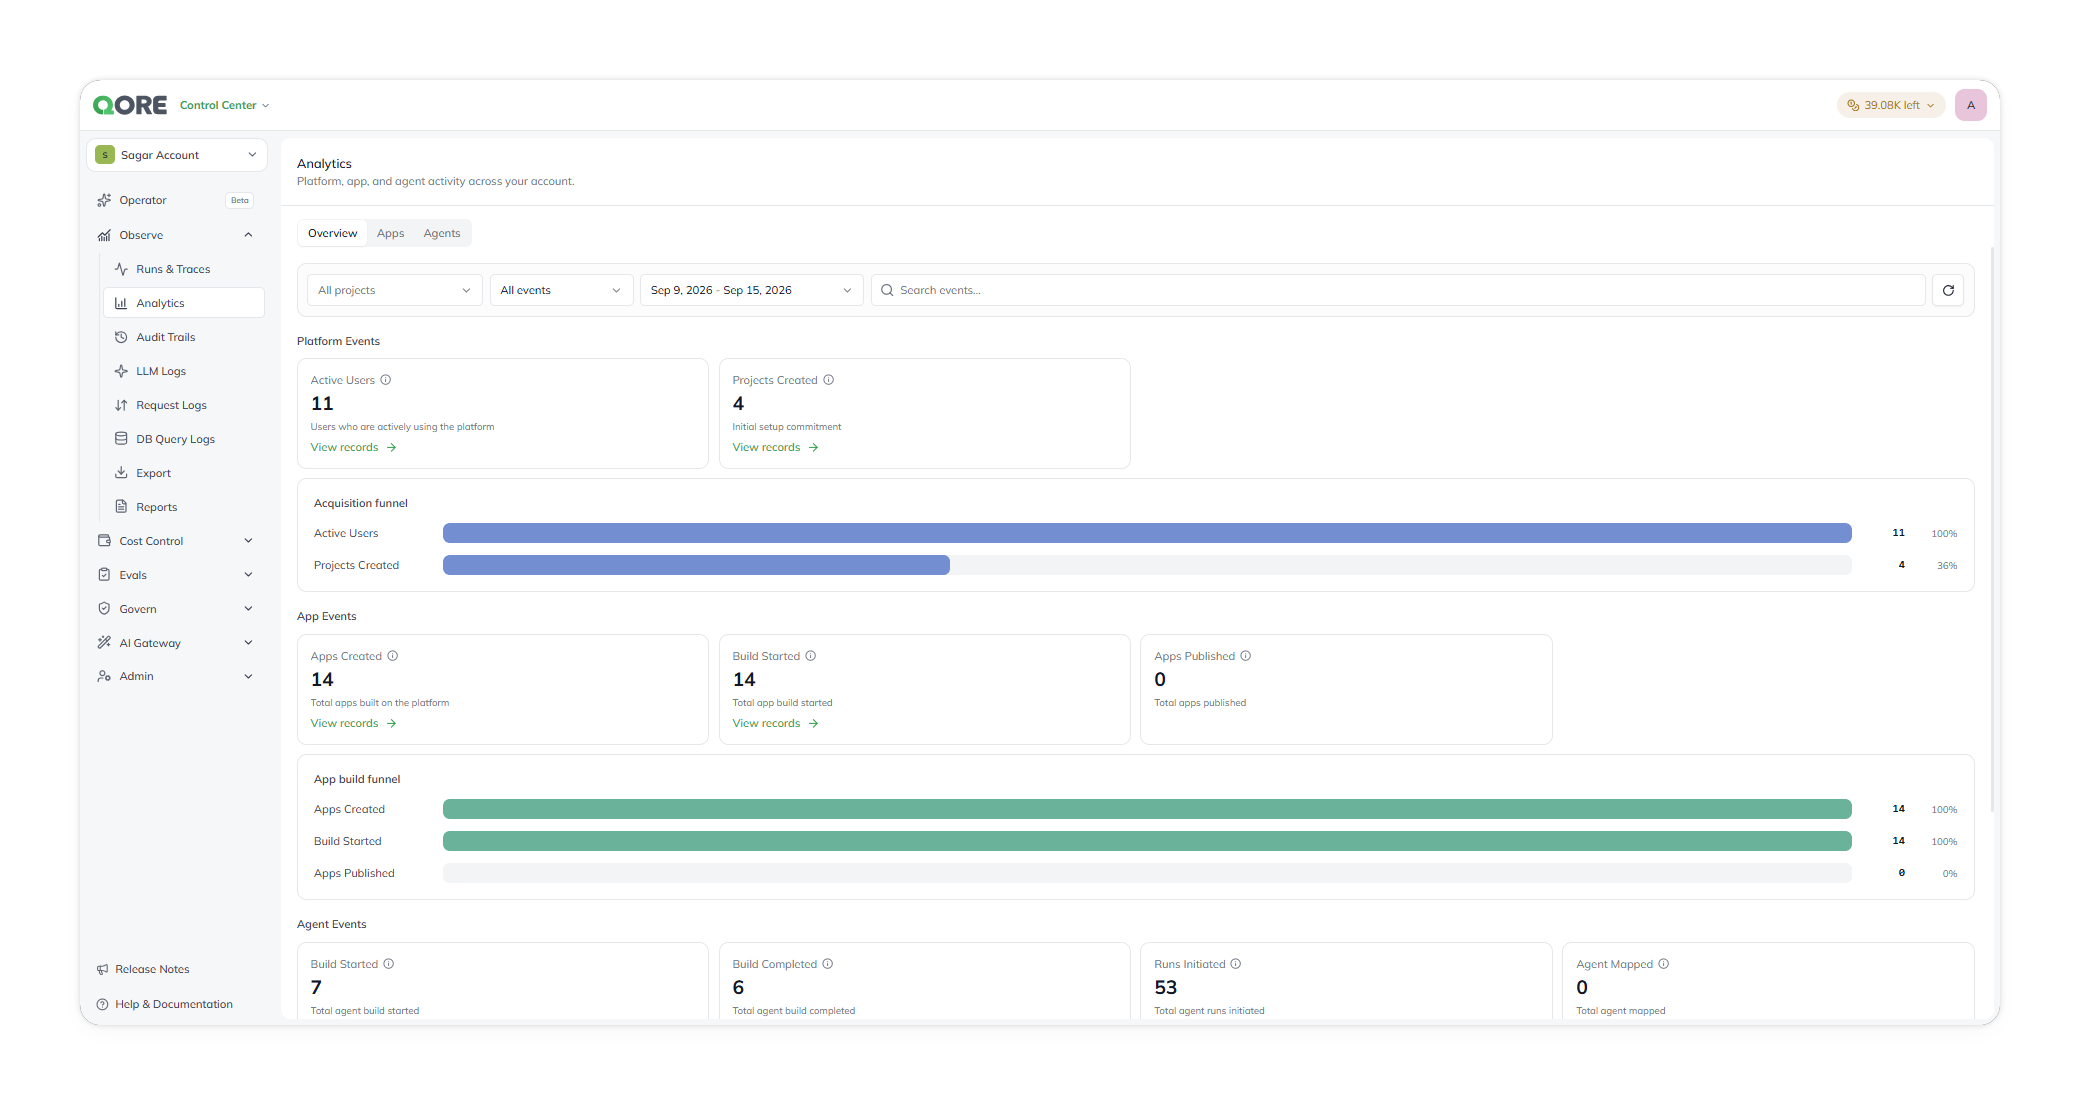
Overview reports account-wide build activity, adoption, and spend — how much is being *built* on the platform, rather than how end users engage with finished apps or how agents perform in production. Open it from **Observability → Analytics**, on the **Overview** tab (the tab Analytics opens on by default).
Overview, reporting account-wide build activity.
Overview has three parts.
* **Platform Events** covers account-wide adoption — **Active Users** and **Projects Created** — with an **Acquisition funnel** showing the same figures as proportions.
* **App Events** covers the app build lifecycle — **Apps Created**, **Build Started**, and **Apps Published** — with an **App build funnel** that shows the same stages as proportions. Wherever a stage has records behind it, a **View records** link takes you to the underlying list.
* **Agent Events** covers the agent lifecycle — **Build Started**, **Build Completed**, **Runs Initiated**, and **Agent Mapped** — with the same kind of **View records** links where records exist.
## Apps
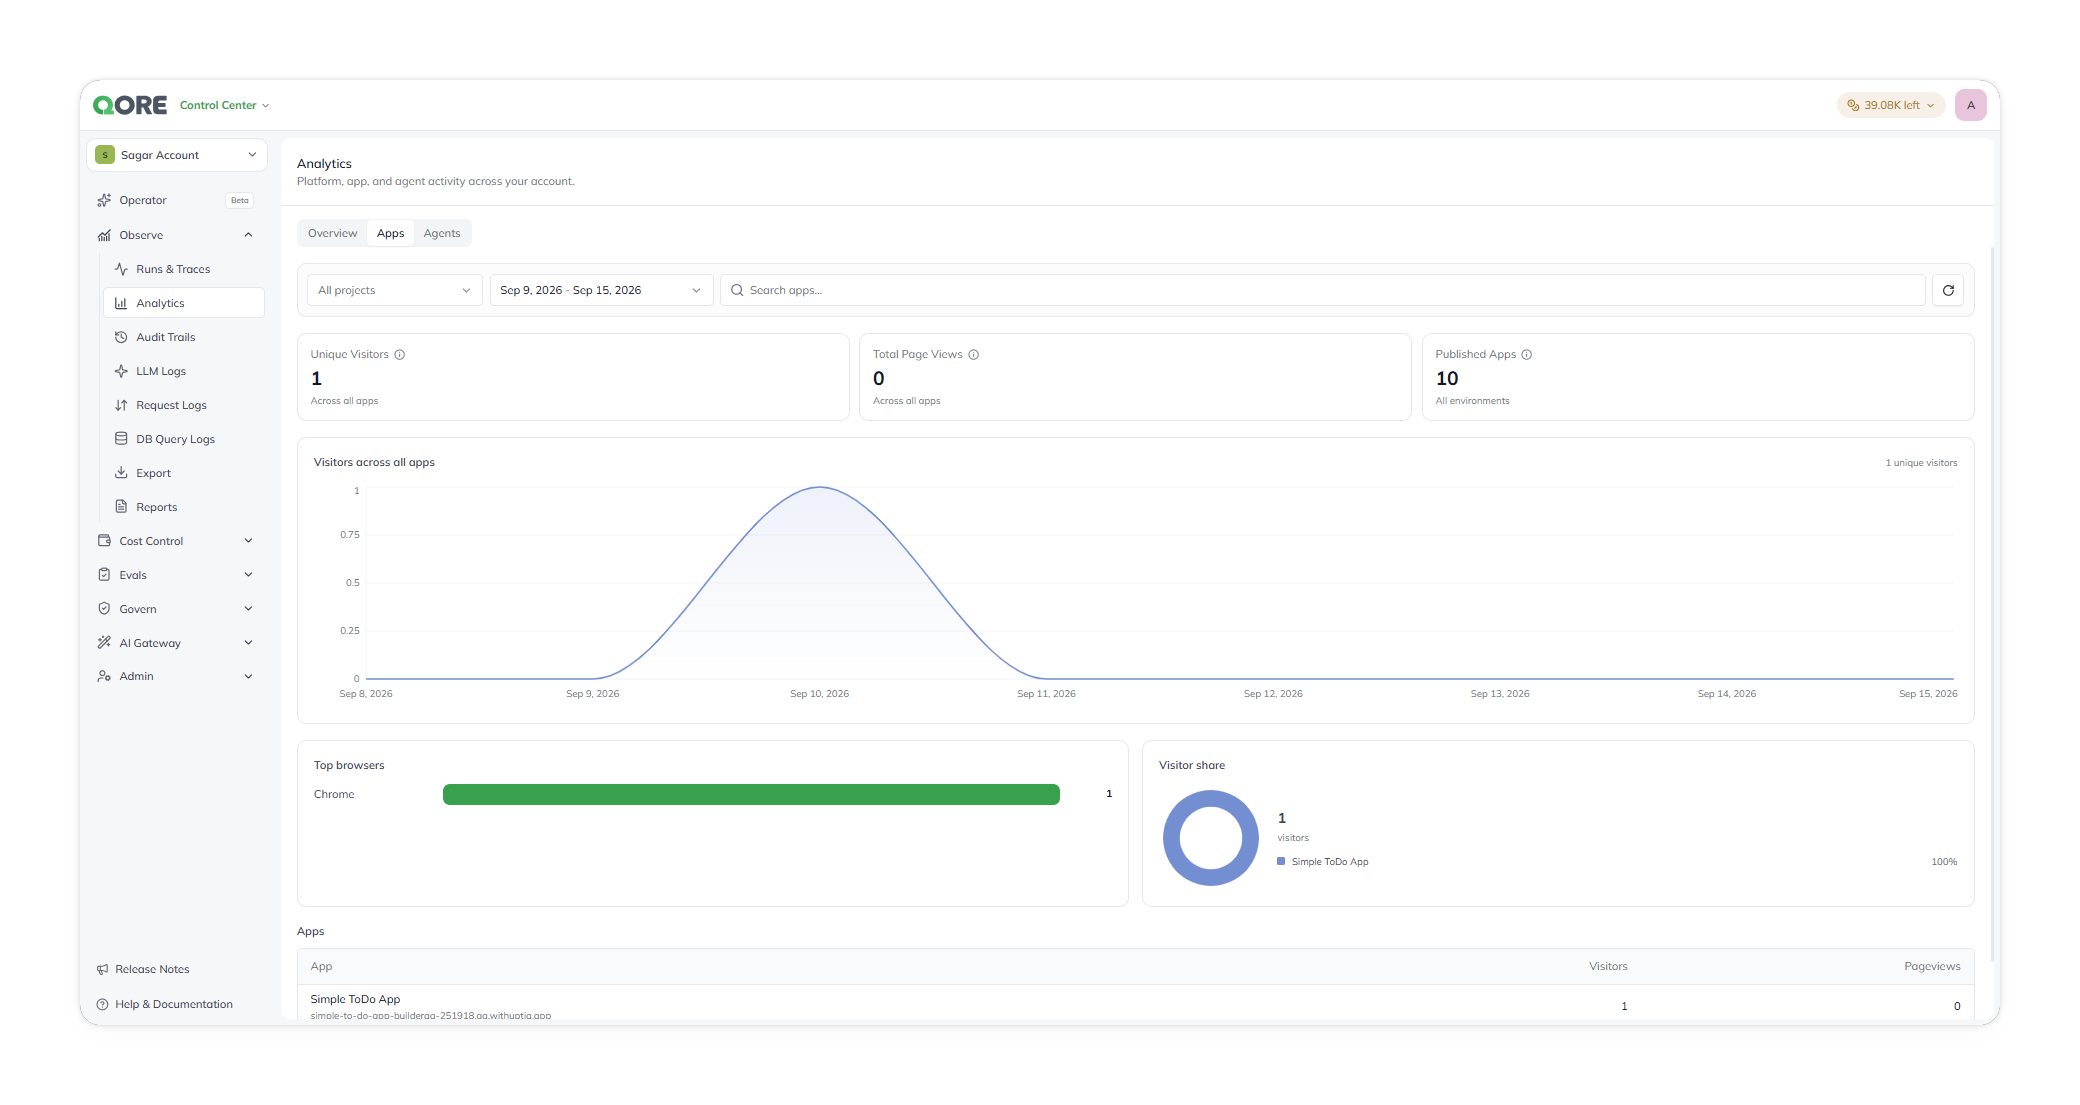
Apps reports usage and engagement across the apps you've published. Open it from **Observability → Analytics**, on the **Apps** tab.
Apps, reporting usage across published apps.
You can narrow the view to a project or a date range, search for a single app, and reload at any time.
For the selected period, this tab reports your **Unique Visitors** — the distinct people who used your apps — your **Total Page Views**, and how many **Published Apps** you have live across all environments. Each figure has a short definition on hover.
It then shows how that usage moves and where it comes from: unique visitors over time, the browsers your visitors used, and how visitors split across your apps by percentage.
Finally, each published app is listed with its **Visitors** and **Pageviews** for the period, shown under the subdomain it was published to.
## Agents
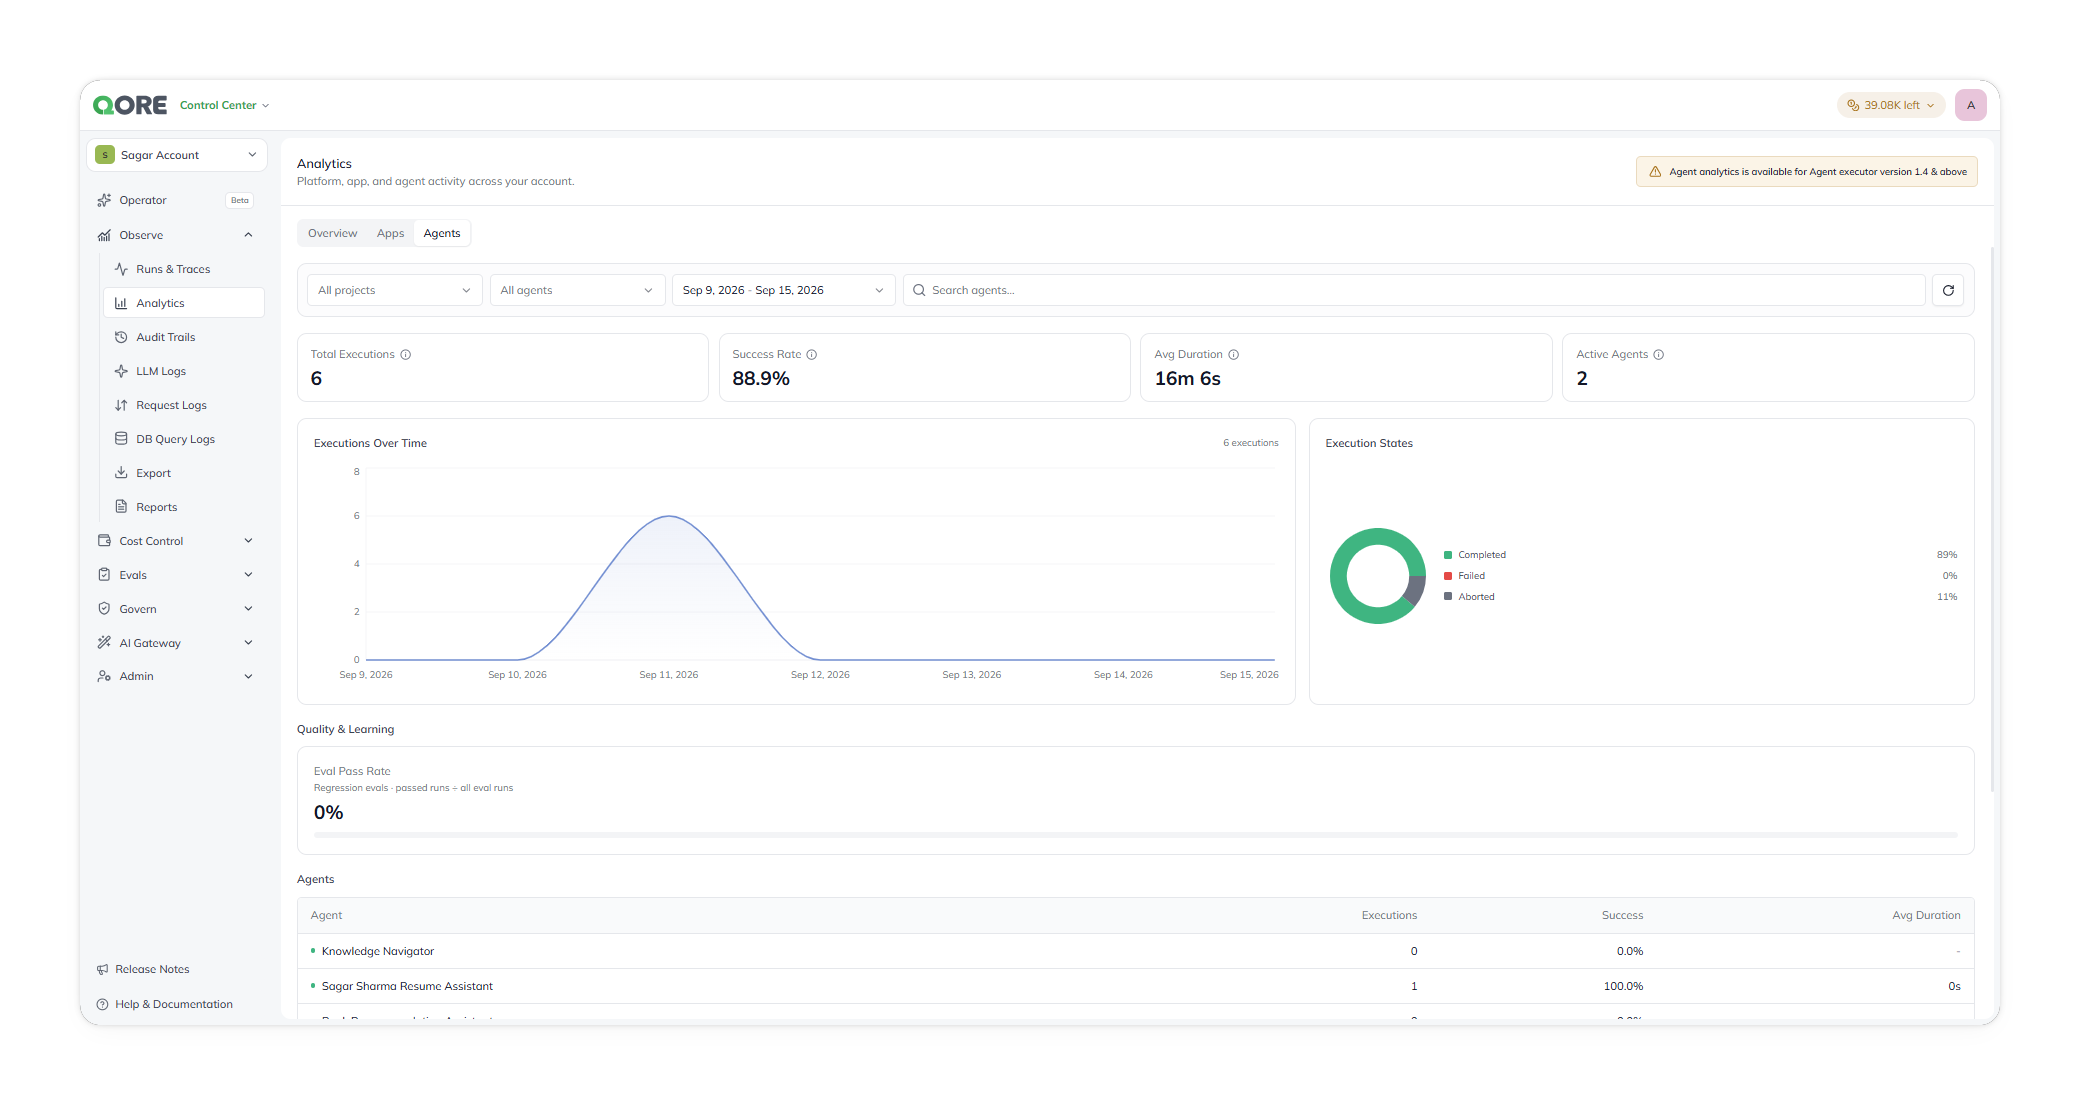
Agents reports execution volume, success, and quality for your agents. Open it from **Observability → Analytics**, on the **Agents** tab.
Agents, reporting execution volume and per-agent performance.
You can narrow the view by project, by agent, or by date range.
For the selected period, this tab reports:
* **Total Executions**, **Success Rate**, **Avg Duration**, and **Active Agents** as stat cards.
* **Executions Over Time**, a chart of execution volume across the period.
* **Execution States**, a donut of Completed / Failed / Aborted share.
* **Quality & Learning → Eval Pass Rate** — the share of regression evals that passed, out of all eval runs.
* An **Agents** table listing each agent's **Executions**, **Success**, and **Avg Duration**.
{% hint style="warning" %}
This tab needs **Agent executor version 1.4 or above**. On an older executor, the page shows a banner saying so instead of data.
{% endhint %}
---
# Agent Instructions
This documentation is published with GitBook. GitBook is the documentation platform designed so that both humans and AI agents can read, navigate, and reason over technical content effectively. Learn more at gitbook.com.
## Querying This Documentation
If you need additional information that is not directly available in this page, you can query the documentation dynamically by asking a question.
Perform an HTTP GET request on the current page URL with the `ask` query parameter, and the optional `goal` query parameter:
```
GET https://docs.uptiq.ai/control-center/observe/analytics.md?ask=&goal=
```
`ask` is the immediate question: it should be specific, self-contained, and written in natural language.
`goal` is optional and describes the broader end goal you are ultimately trying to accomplish on behalf of the user. GitBook uses it to tailor the answer towards what is most useful for that goal.
The response will contain a direct answer to the question and relevant excerpts and sources from the documentation.
Use this mechanism when the answer is not explicitly present in the current page, you need clarification or additional context, or you want to retrieve related documentation sections.