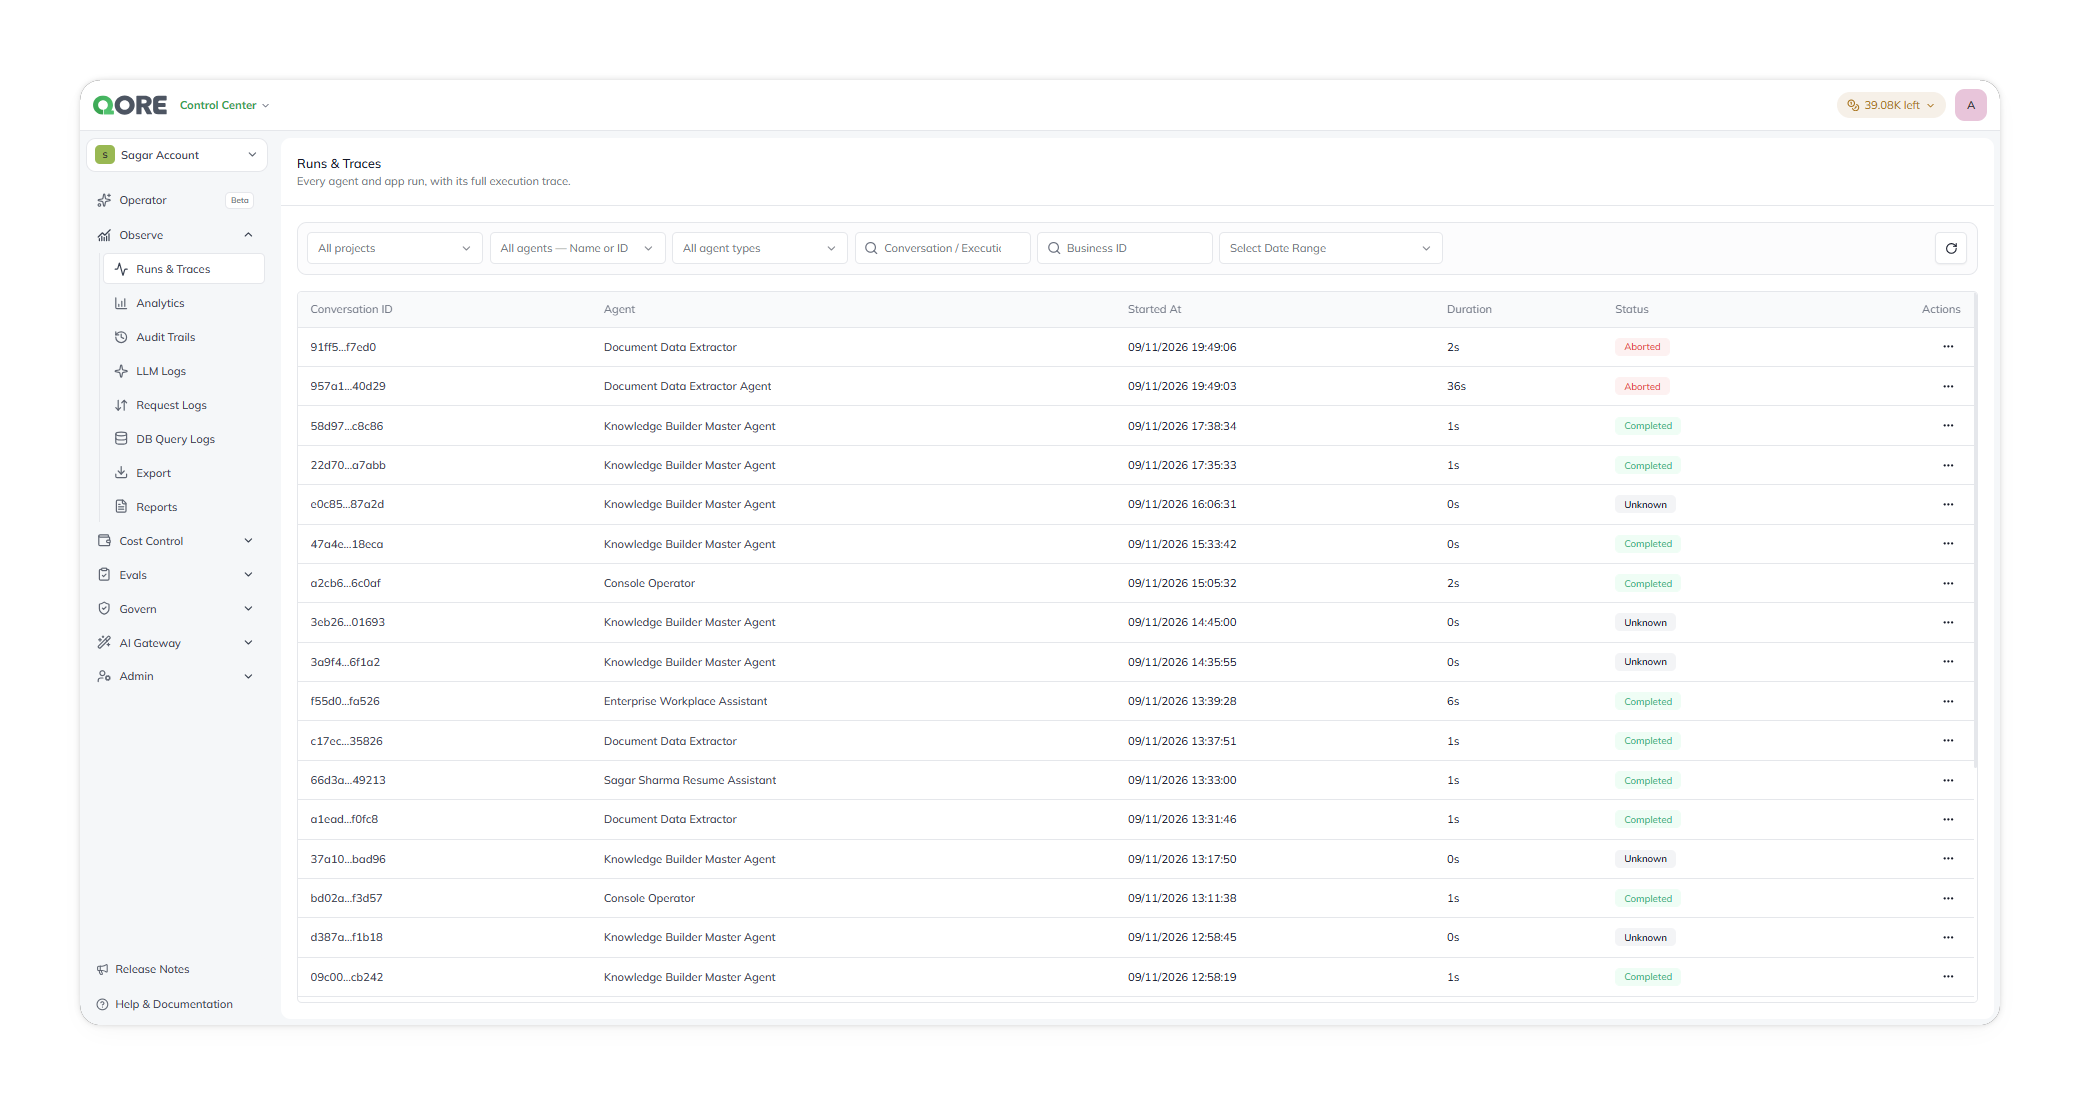
Runs & Traces
Inspect agent executions, trace decisions, and diagnose performance issues quickly.
Runs & Traces records every agent and app execution in your account. It captures LLM calls, tool calls, guardrails, inputs, and outputs at each step.
Use it to inspect an execution as an ordered trace, a dependency graph, or a plain-language summary. It is read-only. You cannot rerun or edit executions here.
Find Runs & Traces in Control Center → Observability → Runs & Traces.
Concepts
Use these terms when investigating an execution.
Run
One agent or app execution.
Investigate work triggered by an API call, schedule, or session.
A run can produce a trace.
Thread
The conversation or session containing a run.
Follow a multi-turn conversation.
A thread can contain several runs.
Trace
The ordered record of one run.
Understand what happened during execution.
It is reconstructed from execution logs.
Span
One trace step.
Isolate an LLM call, tool call, guardrail check, planning step, or retrieval.
It has a name and duration. Token use appears when applicable.
Each span has a name and category. Names include LlmGeneration, DecideOptimalStrategy, and PIIMaskingDetokenize. Categories include Run, LLM, Tool, Retrieval, Reasoning, Guardrail, and Privacy.
Find an execution
Runs are scoped to your current account, and can be narrowed to one project. Results appear newest first, with 10 threads on each page.
Open a thread to inspect its traces. IDs may appear shortened for readability. Point to an ID to reveal the full value. Copy the full trace ID from its details when needed.
Refine the results with one or more criteria. Criteria combine with AND. A project, agent, and date range return only matching runs.
Project
Runs from one project.
Investigating a project-specific issue.
A production project.
Agent name or ID
Runs from one agent.
Triaging one agent.
An agent display name.
Thread or execution ID
One run by its full identifier.
Investigating a reported execution.
An ID from an API response or log.
Business ID
Runs linked to a business identifier.
Matching executions to an app record.
A customer or case identifier.
Date range
Runs by start time.
Narrowing an incident, release, or week.
A defined time window.
Refresh results without changing the URL. Use this when a Waiting run may have progressed.
Inspect a trace
Review spans in execution order with their input and output. Use this view to see what each step received and returned.
Each span provides its name, duration, and token use when applicable. Open a span to examine its name, timestamp, duration, input, and output as JSON.
LLM spans also report the model, provider, input tokens, output tokens, credits, and USD cost. The root Agent run input contains the invocation context. Its agentOptions includes the mode, inline-evaluation flag, and strategy configuration. Use executionId, triggerMethod, agentOptions, piiMaskingConfig, queueId, executorVersion, sdkVersion, and requestId to reproduce a run.
Follow parent and child span relationships. Each span shows its category: Run, LLM, Tool, Retrieval, Reasoning, Guardrail, or Privacy. Categories use colored tags.
Use this view when execution order hides the relationship you need. For example, identify which planning step started a downstream LLM call.
Read a plain-language walkthrough with duration, span, and token totals. Each step has a one-sentence description. For example, an LlmGeneration span reports that the agent generated a response using a language model.
Use this view for a quick review or a ticket-ready walkthrough.
Interpret span types
Executor span names stay consistent across runs.
Agent run
Run
The root span for the execution.
You need the overall invocation context.
Its duration is the run total.
LlmGeneration
LLM
One model call.
A run is slow or costly.
Model, provider, tokens, credits, and USD cost. Long calls often dominate duration.
DecideOptimalStrategy
Reasoning
The agent chose an approach.
The run took an unexpected path.
Review its input and output first.
Planning
Reasoning
The agent defined next steps.
You need to trace an agent decision.
Compare it with DecideOptimalStrategy.
LearningCaseFetch
Retrieval
The run retrieved a learning case or prior context.
Prior context may have affected the result.
Retrieved context.
PIIMaskingTokenize or PIIMaskingDetokenize
Privacy
Sensitive values were masked before a model call and restored after it.
You need to confirm masking behavior.
Duration is usually 0 ms. A piiMaskingConfig.maskingProvider value other than Off confirms masking ran.
Status values
Use status to understand the run’s current state.
Completed — The run finished normally.
Waiting — The run is executing or paused on an external step. This can include an item awaiting Human Review. The status does not distinguish these cases.
Waiting does not automatically mean a run is stuck. If it exceeds its usual duration, check Human Review before treating it as a failure. Refresh results to check for progress.
Use execution details
Use the available execution details to:
Identify the thread ID and agent that produced a run.
Correlate its local-time start timestamp with an incident or deployment.
Find long runs from their total duration, such as
20sor2m 31s.Open additional actions for an individual thread.
Related
Last updated

