> For the complete documentation index, see [llms.txt](https://docs.uptiq.ai/llms.txt). Markdown versions of documentation pages are available by appending `.md` to page URLs; this page is available as [Markdown](https://docs.uptiq.ai/control-center/observe/reports.md).

# Reports

Review usage and execution reports for projects and date ranges.

Review platform usage and execution data for selected projects and dates. Read results in the platform or receive them by email in `PDF`, `CSV`, or `JSON`.

{% hint style="info" %}
Available report types may vary by tenant, plan, or role.
{% endhint %}

## At a glance

Reports cover credit usage and agent executions. Choose a project scope, date range, and delivery format.

| Task            | Information you provide         | Result                   |
| --------------- | ------------------------------- | ------------------------ |
| Review activity | Project and date range          | A report results table   |
| Share data      | Project, date range, and format | A file sent by email     |
| Focus analysis  | One project                     | Results for that project |

## Overview

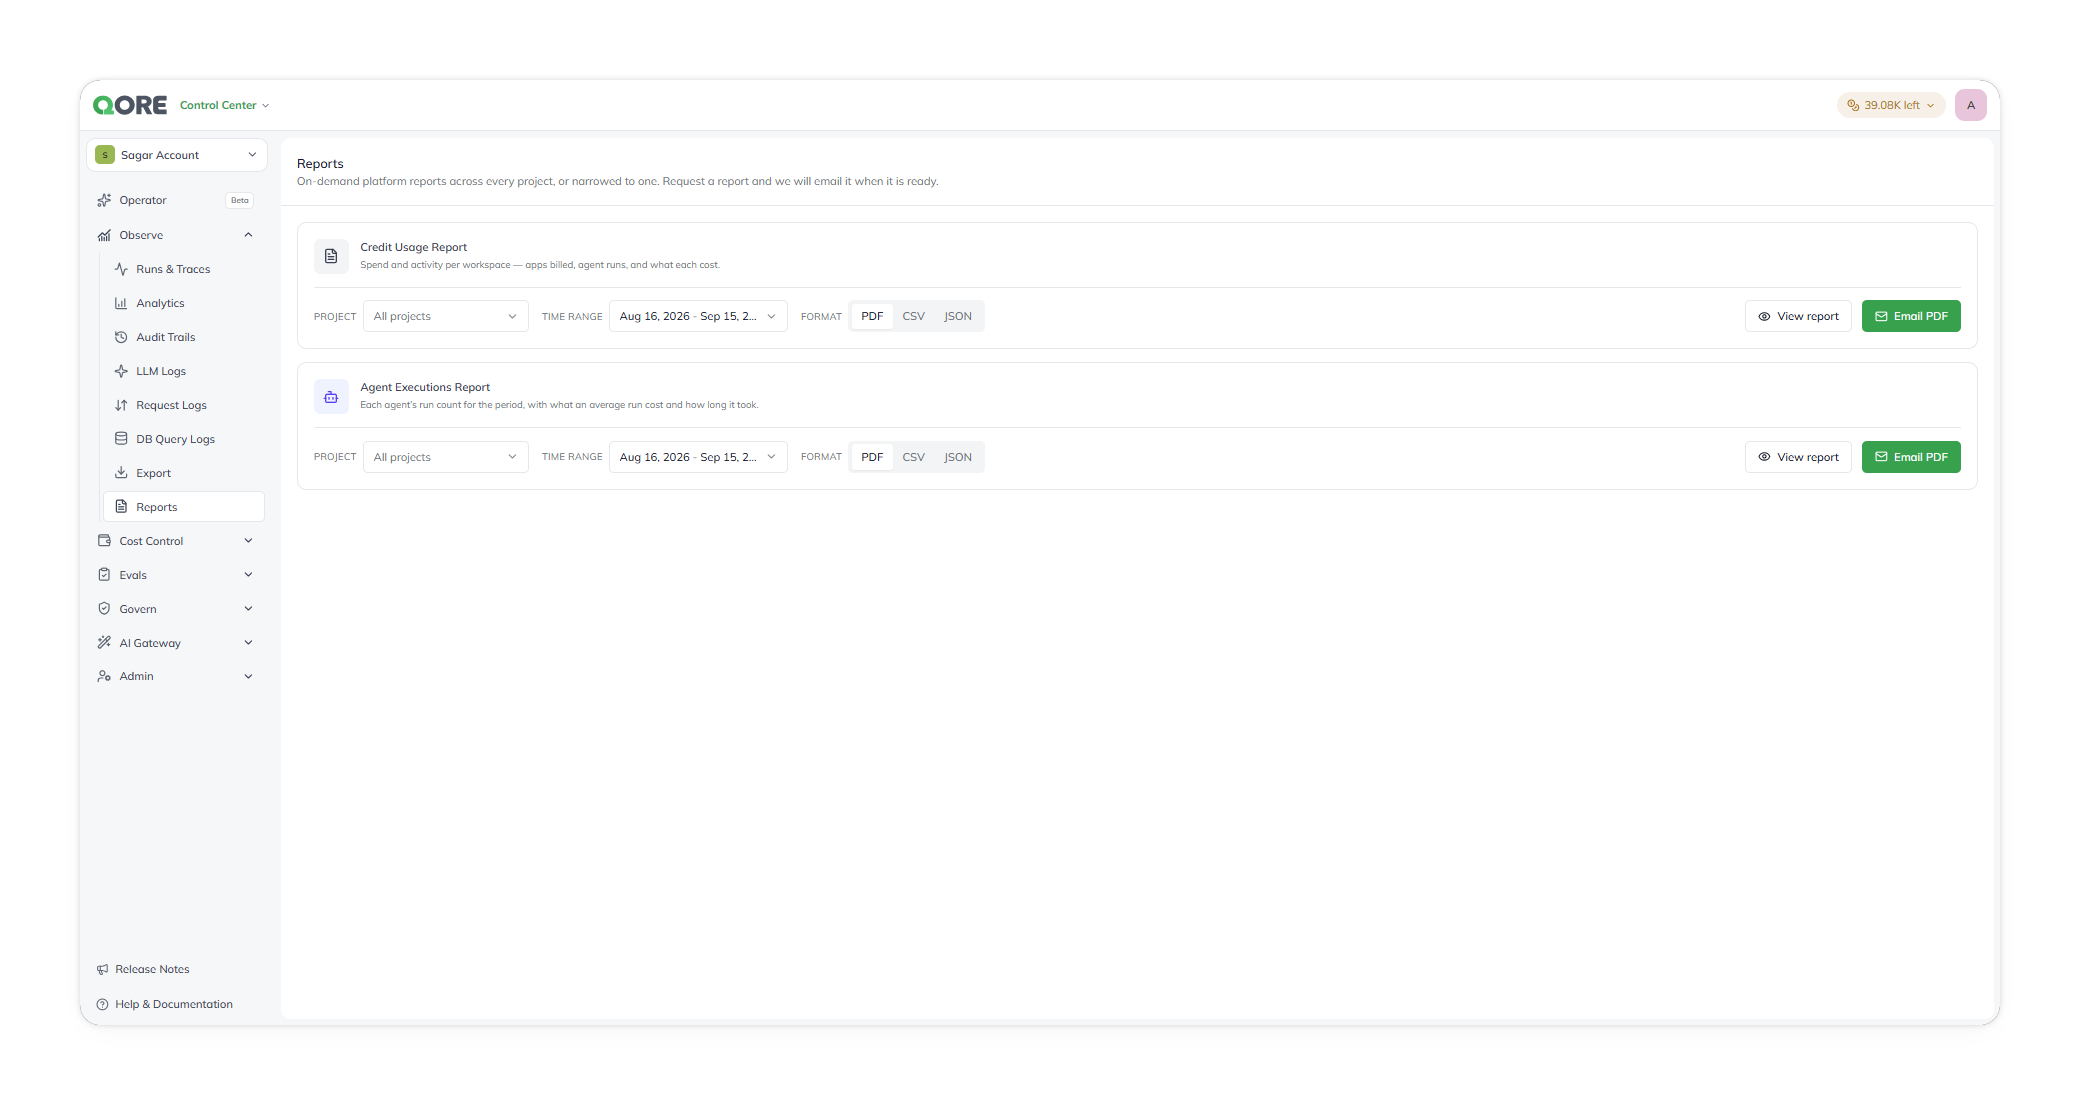
<figure><img src="https://1326225582-files.gitbook.io/~/files/v0/b/gitbook-x-prod.appspot.com/o/spaces%2F0qmgQjJ5aArDTj2ACFHG%2Fuploads%2Fgit-blob-45ddda2c49a92a90696b0d55ced6b0d644c620b4%2Fqore_control-center_control-centre-observability-reports_rounded_shadow.png?alt=media" alt="The Reports screen, listing the Credit Usage Report and Agent Executions Report cards, each with project, time range, format, and delivery controls"><figcaption><p>Reports, with its two fixed report types.</p></figcaption></figure>

Reports are fixed templates. You can't add, edit, delete, or reorder report types.

For each report, choose a project scope, date range, and delivery format. Each request creates one report.

> Set the date range explicitly for billing- or SLA-critical reporting.

## Choose report details

Provide the details below before reviewing or emailing a report.

| Report detail   | Default      | Available choices               | How it affects results        |
| --------------- | ------------ | ------------------------------- | ----------------------------- |
| Project scope   | All projects | Every project or one project    | Limits included projects      |
| Date range      | This Month   | Calendar dates or preset ranges | Limits included activity      |
| Delivery format | PDF          | PDF, CSV, or JSON               | Applies to emailed files only |

Search for a project when you need a narrower scope. The date picker includes the current and next month. It also includes `Today`, `Yesterday`, `Last 7 days`, `Last 30 days`, `This Week`, `This Month`, and `Last Month`.

Date ranges use calendar dates, not wall-clock ranges. Choose exact dates when your work crosses UTC midnight.

{% hint style="info" %}
The starting date range can change after you use another report. Set it again before requesting a report.
{% endhint %}

Read a report as an HTML table for the selected project scope and date range. This result doesn't depend on the delivery format.

Email creates the chosen file format and sends it to the signed-in user. Preparation happens in the background. A download isn't available from the report page, and reports can't run on a schedule.

## Available reports

{% tabs %}
{% tab title="Credit Usage Report" %}
*"Spend and activity per workspace—apps billed, agent runs, and their cost."*

Results and exported files include these report fields:

| Report field               | Meaning           | Grouping                            | Period              |
| -------------------------- | ----------------- | ----------------------------------- | ------------------- |
| Workspace                  | Workspace name    | One row for each included workspace | Selected date range |
| Apps                       | Billed app count  | Workspace                           | Selected date range |
| Agent Executions           | Agent run count   | Workspace                           | Selected date range |
| $ Spend — Apps             | App billing spend | Workspace                           | Selected date range |
| $ Spend — Agent Executions | Agent run spend   | Workspace                           | Selected date range |

Results sort by `$ Spend — Agent Executions` in descending order. Each results page shows 25 rows. Move through additional results with the previous and next actions. Workspace names are informational, not links.

<figure><img src="https://1326225582-files.gitbook.io/~/files/v0/b/gitbook-x-prod.appspot.com/o/spaces%2F0qmgQjJ5aArDTj2ACFHG%2Fuploads%2Fgit-blob-80e5eae4967c28b9e5b88e90a052500175f7680a%2Fqore_control-center_control-centre-observability-reports-credit-usage-modal_rounded_shadow.png?alt=media" alt="The Credit Usage Report results, listing each workspace with its Apps, Agent Executions, and dollar spend on apps and agent executions"><figcaption><p>Credit Usage Report results, one row per workspace.</p></figcaption></figure>
{% endtab %}

{% tab title="Agent Executions Report" %}
*"Each agent's run count, average cost, and average duration."*

Results and exported files include these report fields:

| Report field         | Meaning                                  | Grouping                             | Period              |
| -------------------- | ---------------------------------------- | ------------------------------------ | ------------------- |
| Agent                | Agent name                               | One row for each agent with activity | Selected date range |
| Executions           | Agent run count                          | Agent                                | Selected date range |
| Avg Cost / Execution | Mean cost for each execution             | Agent                                | Selected date range |
| Avg Duration (ms)    | Mean wall-clock duration in milliseconds | Agent                                | Selected date range |

Results sort by `Executions` in descending order. Agents without executions don't appear. Agent names are informational, not links.

<figure><img src="https://1326225582-files.gitbook.io/~/files/v0/b/gitbook-x-prod.appspot.com/o/spaces%2F0qmgQjJ5aArDTj2ACFHG%2Fuploads%2Fgit-blob-bc2c53fd2bd433ebfa441f38d9d3a034402ab1b5%2Fqore_control-center_control-centre-observability-reports-agent-executions-modal_rounded_shadow.png?alt=media" alt="The Agent Executions Report results, listing each agent with its Executions, Avg Cost per Execution, and Avg Duration"><figcaption><p>Agent Executions Report results, one row per agent.</p></figcaption></figure>
{% endtab %}
{% endtabs %}

## Review usage

### View last month's spend

Use this report to see agent execution spend by project.

{% stepper %}
{% step %}

#### Choose the project scope

Leave the project scope set to **All projects**.
{% endstep %}

{% step %}

#### Choose the date range

Choose `Last Month`. The selected range can read `Jul 1, 2026 – Jul 31, 2026`.
{% endstep %}

{% step %}

#### Review the results

Generate the report. Results sort by `$ Spend — Agent Executions` in descending order. Review additional projects with previous and next actions. Dismiss results with `Esc`.
{% endstep %}
{% endstepper %}

### Email last week's agent activity

Use this report to receive a CSV for one project.

{% stepper %}
{% step %}

#### Set the project scope

Choose the project whose agent activity you want to review.
{% endstep %}

{% step %}

#### Set the time range

Choose `Last 7 days`.
{% endstep %}

{% step %}

#### Select the file format

Choose `CSV` as the delivery format.
{% endstep %}

{% step %}

#### Send the report

Request the email delivery. The report arrives when it's ready. A download isn't available from the report page.
{% endstep %}
{% endstepper %}

{% hint style="info" %}
Report types are provided by the platform. Contact Uptiq if you need another type.
{% endhint %}

## Related

<table data-view="cards"><thead><tr><th>Title</th><th>Description</th><th data-card-target data-type="content-ref">Link</th></tr></thead><tbody><tr><td><strong>Export</strong></td><td>Create recurring raw-data exports. Reports provide rendered summaries.</td><td><a href="/control-center/observe/export.md">Export</a></td></tr><tr><td><strong>Credit usage</strong></td><td>Review the interactive credit-consumption view behind the Credit Usage Report.</td><td><a href="/control-center/cost-control/credit-usage.md">Credit Usage</a></td></tr><tr><td><strong>Runs &#x26; Traces</strong></td><td>Inspect individual agent executions behind the Agent Executions Report.</td><td><a href="/control-center/observe/runs-and-traces.md">Runs &amp; Traces</a></td></tr><tr><td><strong>Analytics</strong></td><td>Review broader platform activity in an interactive view.</td><td><a href="/control-center/observe/analytics.md">Analytics</a></td></tr></tbody></table>


---

# Agent Instructions
This documentation is published with GitBook. GitBook is the documentation platform designed so that both humans and AI agents can read, navigate, and reason over technical content effectively. Learn more at gitbook.com.

## Querying This Documentation
If you need additional information that is not directly available in this page, you can query the documentation dynamically by asking a question.

Perform an HTTP GET request on the current page URL with the `ask` query parameter, and the optional `goal` query parameter:

```
GET https://docs.uptiq.ai/control-center/observe/reports.md?ask=<question>&goal=<endgoal>
```

`ask` is the immediate question: it should be specific, self-contained, and written in natural language.
`goal` is optional and describes the broader end goal you are ultimately trying to accomplish on behalf of the user. GitBook uses it to tailor the answer towards what is most useful for that goal.

The response will contain a direct answer to the question and relevant excerpts and sources from the documentation.

Use this mechanism when the answer is not explicitly present in the current page, you need clarification or additional context, or you want to retrieve related documentation sections.
