> For the complete documentation index, see [llms.txt](https://docs.uptiq.ai/llms.txt). Markdown versions of documentation pages are available by appending `.md` to page URLs; this page is available as [Markdown](https://docs.uptiq.ai/task-guides/monitor-activity.md).
# Monitor activity
Every Observe task in Control Center: trace runs, read analytics, audit changes, inspect logs, and export or report on activity.
This guide is organized by task. Find what you want to do in the list below, then follow the steps. Each task links to the reference page it comes from.
Everything in Control Center is account-wide; most Observe screens can be narrowed to one project. What you can see depends on your Control Center role.
| Task | Go to |
| ------------------------------------------- | -------------------------------------------------------- |
| Find an agent or app run | [Find a run](#find-an-agent-or-app-run) |
| Inspect what happened during a run | [Inspect a trace](#inspect-what-happened-during-a-run) |
| Understand a run's status | [Run status](#understand-a-run-status) |
| See account-wide build activity | [Overview](#see-account-wide-build-activity) |
| See how published apps are used | [Apps](#see-how-published-apps-are-used) |
| See how agents perform | [Agents](#see-how-agents-perform) |
| See who changed what in the account | [Audit Trails](#see-who-changed-what-in-the-account) |
| See every model call, its tokens and cost | [Gateway Logs](#see-every-model-call) |
| See every embedding call | [Embedding Logs](#see-every-embedding-call) |
| See requests the platform received | [Incoming requests](#see-requests-the-platform-received) |
| See requests the platform sent out | [Outgoing requests](#see-requests-the-platform-sent) |
| See database operations | [DB Query Logs](#see-database-operations) |
| Export activity data, once or on a schedule | [Export](#export-activity-data) |
| Change or re-download an export | [Track exports](#track-and-update-exports) |
| Review a usage or execution report | [Reports](#review-a-usage-or-execution-report) |
| Email a report | [Email a report](#email-a-report) |
***
## :route: Runs & Traces
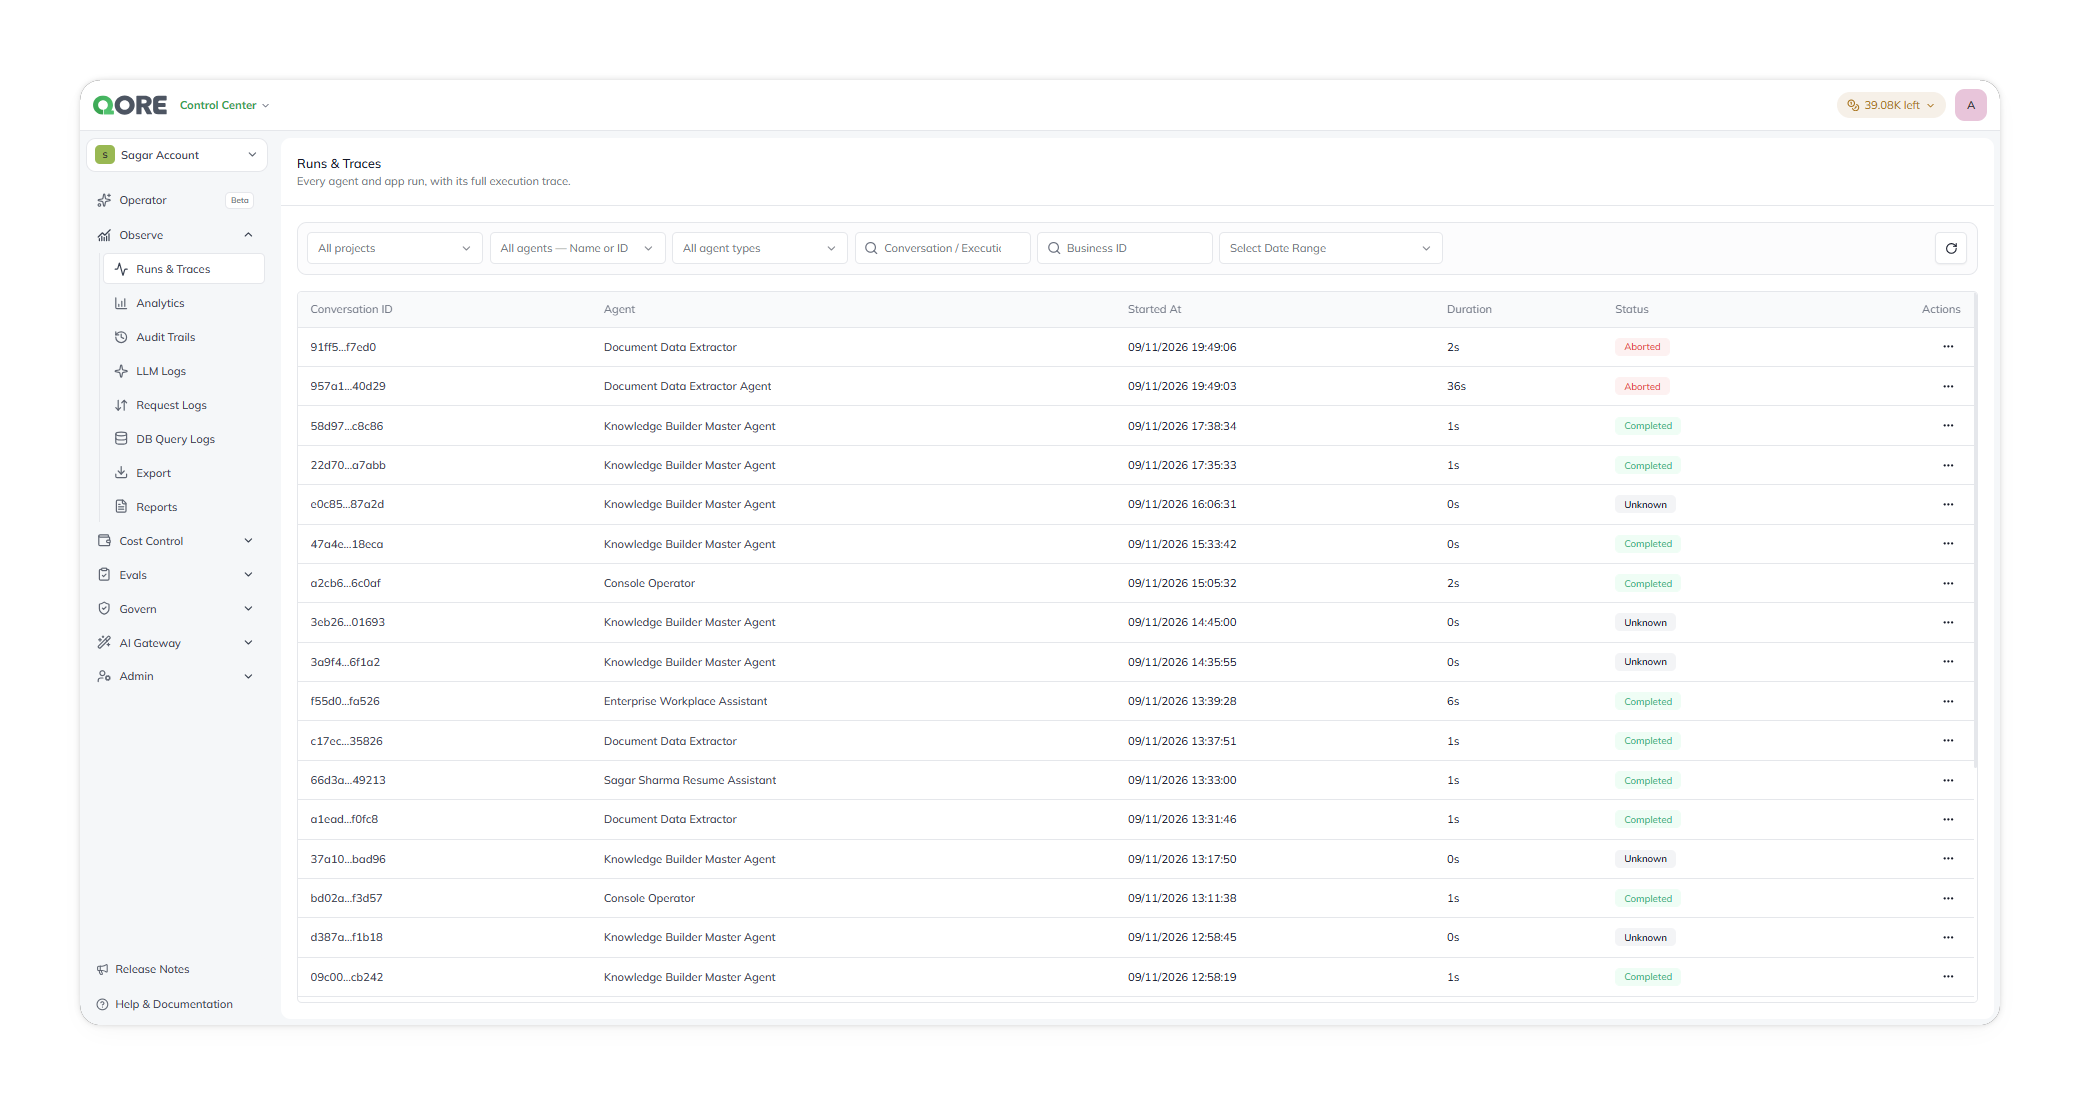
Runs & Traces records every agent and app execution in the account: LLM calls, tool calls, guardrails, inputs, and outputs at each step. It is read-only: you can't rerun or edit executions here.
### Find an agent or app run
{% stepper %}
{% step %}
#### Open Runs & Traces
Open **Observe** › **Runs & Traces**. Runs appear newest first, with 10 threads on each page.
{% endstep %}
{% step %}
#### Narrow the results
Combine any of these; they combine with `AND`:
* **Project** — runs from one project.
* **Agent name or ID** — runs from one agent.
* **Thread or execution ID** — one run by its full identifier.
* **Business ID** — runs linked to a business identifier.
* **Date range** — runs by start time.
{% endstep %}
{% step %}
#### Open the thread
Open a thread to see its agent name, full thread ID, and traces. Each trace shows its opening prompt, ID, start time, duration, and span total.
{% endstep %}
{% endstepper %}
Runs & Traces.
IDs may appear shortened; point to one to reveal the full value. Refresh the results without changing the URL. Reference: [Runs & Traces › Find an execution](/control-center/observe/runs-and-traces.md#find-an-execution).
### Inspect what happened during a run
Open a trace, then choose a view:
* **Trace** — spans in execution order, with their input and output. Open a span to see its name, timestamp, duration, input, and output as JSON. LLM spans also report the model, provider, input and output tokens, credits, and USD cost.
* **Graph** — parent and child span relationships, each tagged with its category: Run, LLM, Tool, Retrieval, Reasoning, Guardrail, or Privacy.
* **Summary** — a plain-language walkthrough with duration, span, and token totals.
Copy the full trace ID into a ticket, log query, or API call. `No traces to display` means the logs couldn't reconstruct spans; it doesn't mean the run failed. Reference: [Runs & Traces › Inspect a trace](/control-center/observe/runs-and-traces.md#inspect-a-trace).
### Understand a run status
* **Completed** — the run finished normally.
* **Waiting** — the run is executing, or paused on an external step, which can include an item awaiting Human Review. The status doesn't distinguish these.
`Waiting` doesn't automatically mean a run is stuck. If it exceeds its usual duration, check [Human Review](/task-guides/evaluate-agent-quality.md#review-a-low-confidence-result) before treating it as a failure. Reference: [Runs & Traces › Status values](/control-center/observe/runs-and-traces.md#status-values).
***
## :chart-pie: Analytics
Analytics is one page with three tabs. Filter by project; each tab has its own date-range filter. Open **Observe** › **Analytics**.
### See account-wide build activity
On the **Overview** tab (the default):
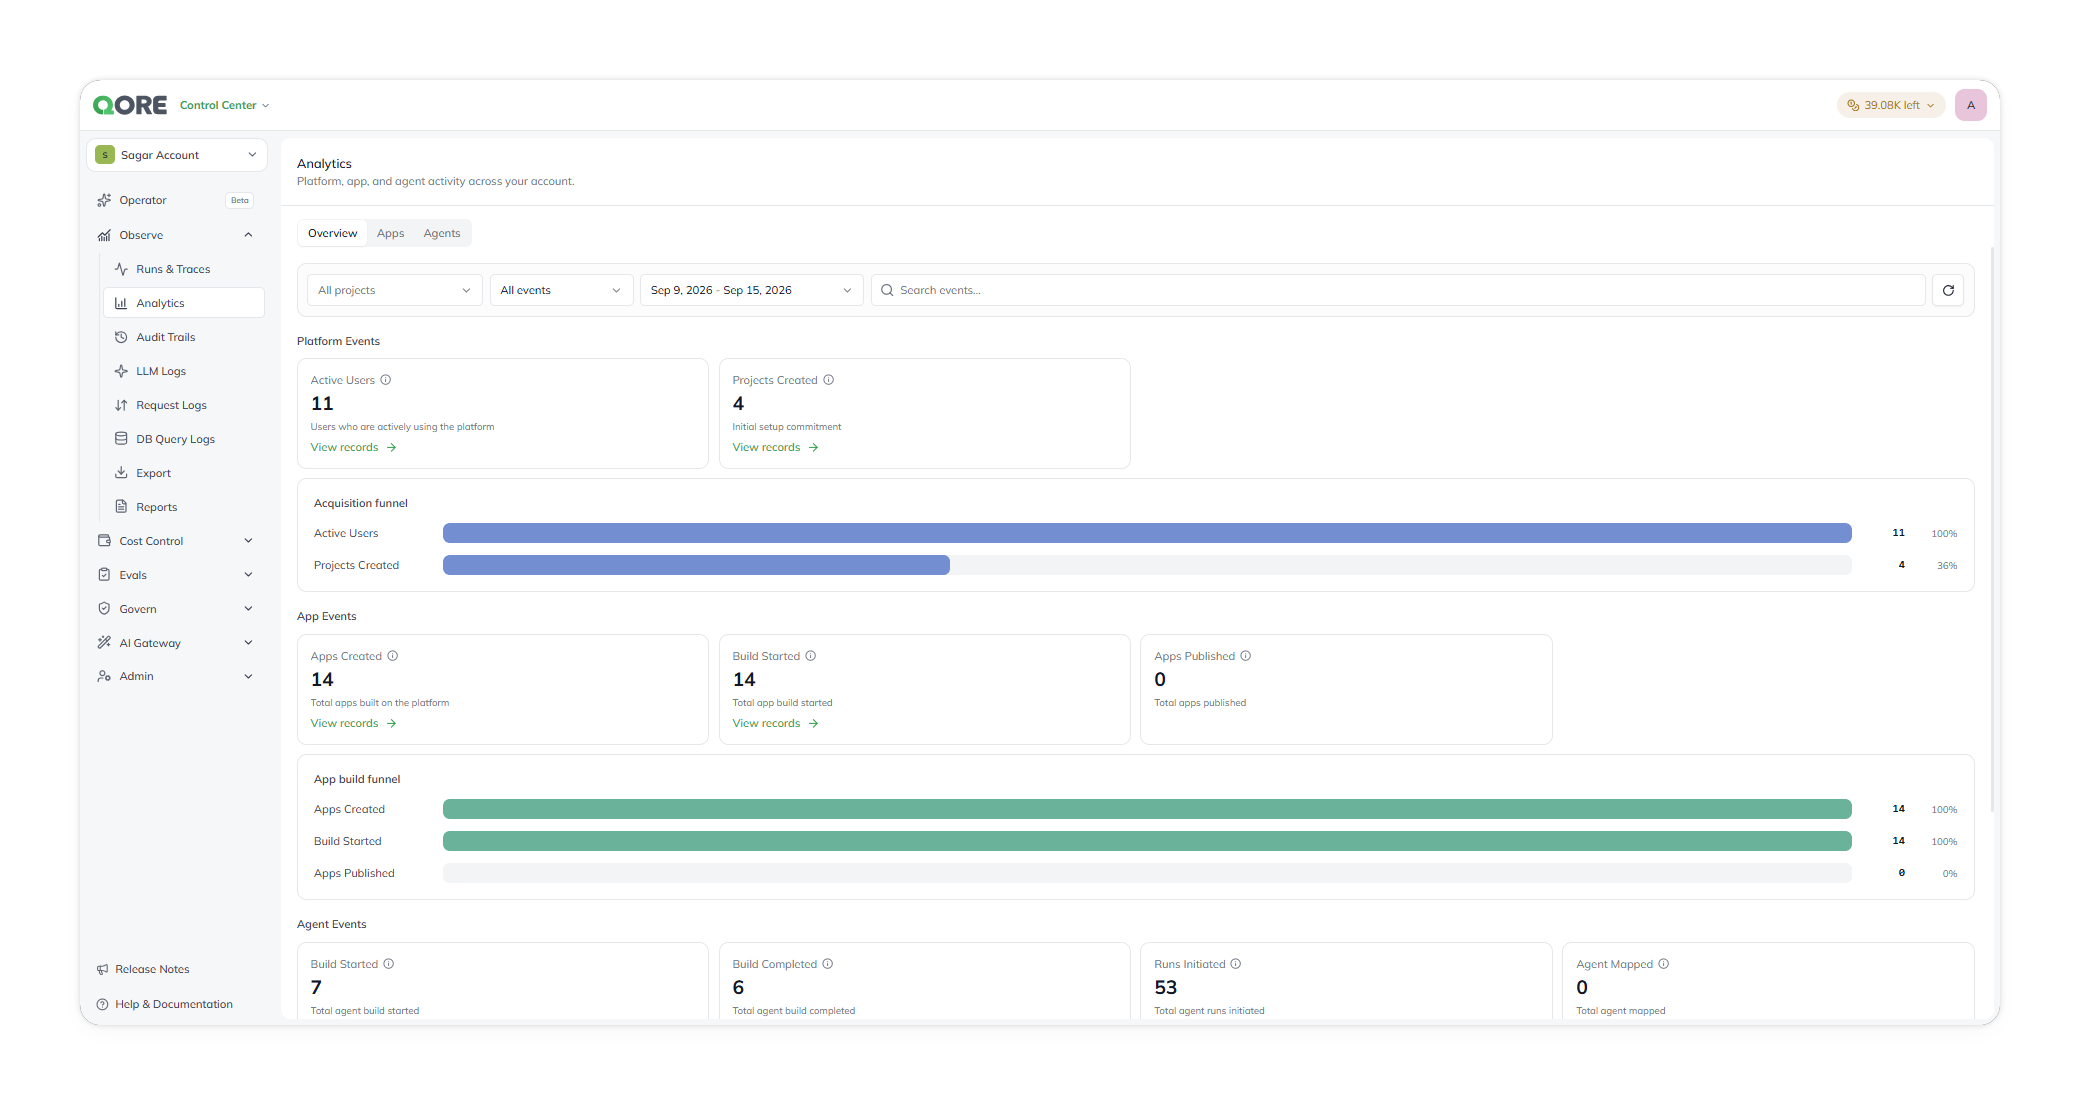
* **Platform Events** — **Active Users** and **Projects Created**, with an **Acquisition funnel**.
* **App Events** — **Apps Created**, **Build Started**, and **Apps Published**, with an **App build funnel**.
* **Agent Events** — **Build Started**, **Build Completed**, **Runs Initiated**, and **Agent Mapped**.
Where a stage has records behind it, **View records** opens the underlying list.
Analytics, Overview tab.
### See how published apps are used
On the **Apps** tab, narrow by project or date range, search for an app, or reload. It reports **Unique Visitors**, **Total Page Views**, and **Published Apps**; unique visitors over time; browsers; how visitors split across apps; and each published app's **Visitors** and **Pageviews**, under the subdomain it was published to.
### See how agents perform
On the **Agents** tab, narrow by project, agent, or date range. It reports **Total Executions**, **Success Rate**, **Avg Duration**, and **Active Agents**; **Executions Over Time**; **Execution States** (Completed / Failed / Aborted); **Quality & Learning** › **Eval Pass Rate**; and an **Agents** table with each agent's **Executions**, **Success**, and **Avg Duration**.
{% hint style="warning" %}
The **Agents** tab needs agent executor version 1.4 or above. On an older executor, it shows a banner instead of data.
{% endhint %}
Reference: [Analytics](/control-center/observe/analytics.md).
***
## :clipboard-list: Audit and logs
### See who changed what in the account
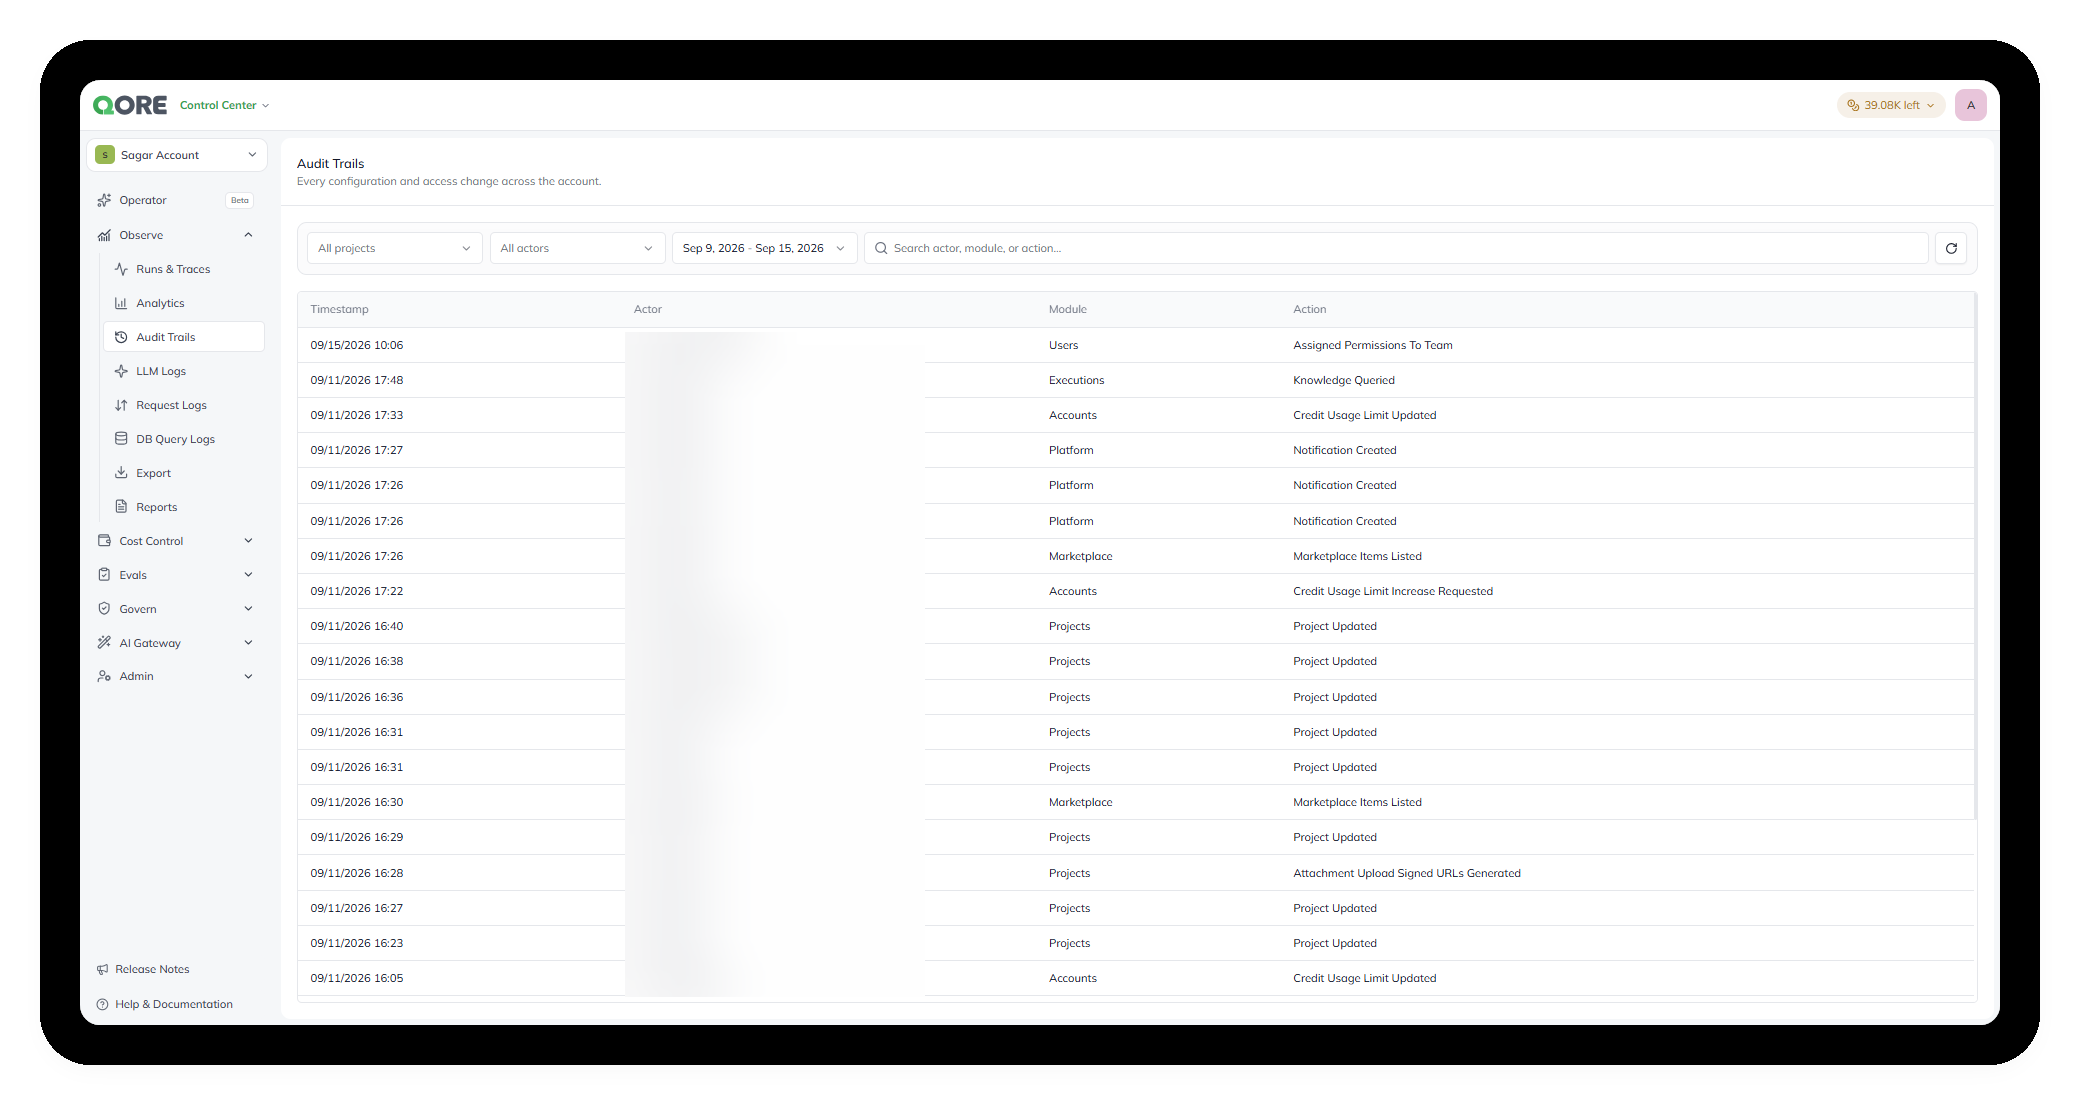
Open **Observe** › **Audit Trails**. Filter by project, actor, or date range, and search by actor, module, or action. Entries appear most recent first, each with its **Timestamp**, **Actor** (by email), **Module** (such as **Accounts**, **Users**, **Knowledge**, or **Agents**), and **Action** (such as **Created**, **Updated**, or **User Invited**).
Audit Trails.
Reference: [Audit Trails](/control-center/observe/audit-trails.md).
### See every model call
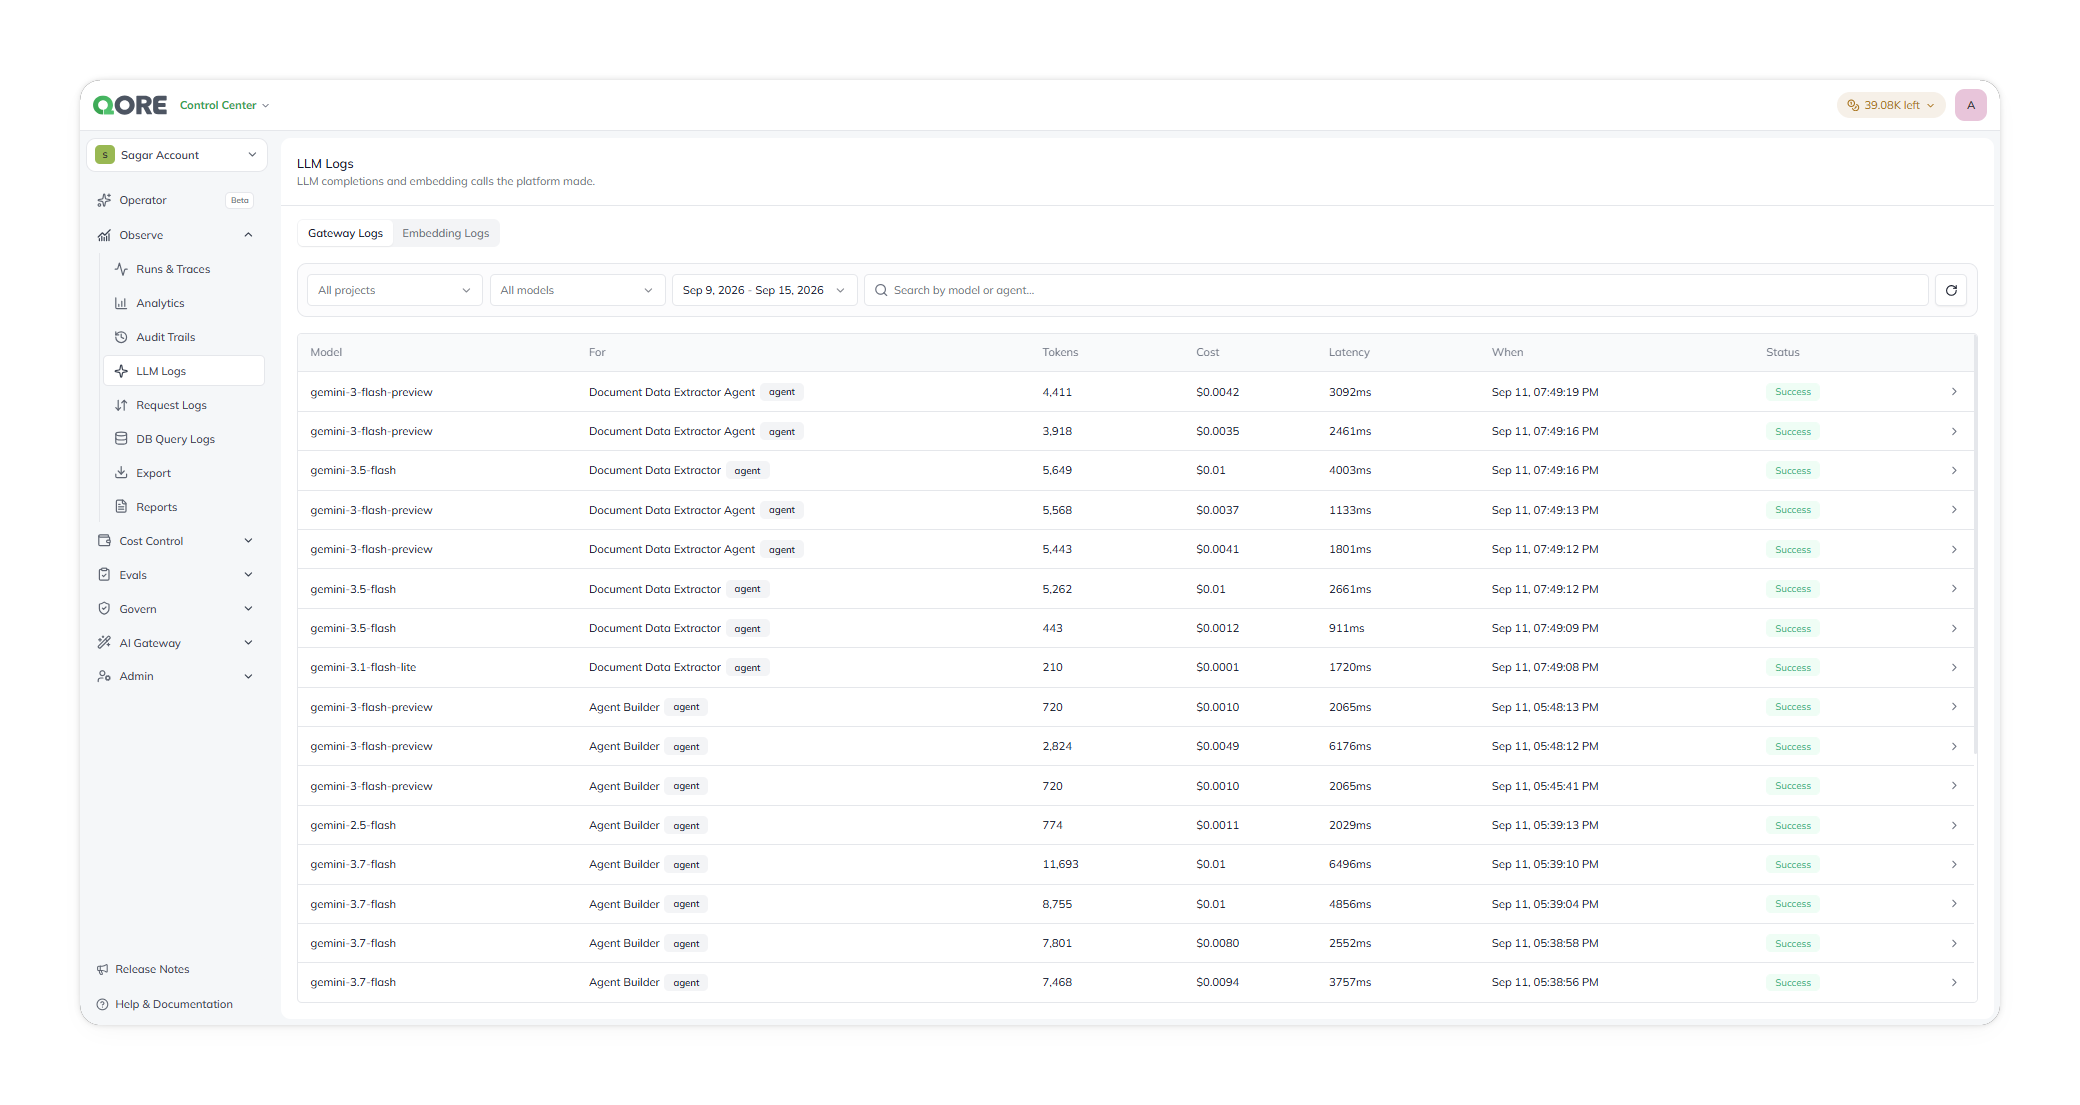
Open **Observe** › **LLM Logs**, on the **Gateway Logs** tab. Narrow by project and model, and search by model or agent. Each row is one completed call, with its **Model**, **For** (the target), **Tokens**, **Cost**, **Latency** (ms), **When**, and **Status**. Select a row for the full detail.
LLM Logs, Gateway Logs tab.
### See every embedding call
On **LLM Logs**, select **Embedding Logs**. Every query sent to an embedding model is listed, including failed calls. Narrow by project, model, and date range; search by query or model. Each row shows the **Query**, **Model**, **When**, and **Status** (**Success** or **Failed**). Expand a row for the full query text, the model, and the duration in milliseconds.
Reference: [LLM Logs](/control-center/observe/llm-logs.md).
### See requests the platform received
Open **Observe** › **Request Logs**, then **Incoming Request Logs**. Narrow by project and date range, filter by module (**Agent**, **App**, **Skill**, **Integrations**, **Marketplace**, **Platform**) and method (**GET**, **POST**, **PUT**, **PATCH**, **DELETE**), and search the log. Each row shows the **Method**, **URL**, and **When**. Select a row for the full request.
### See requests the platform sent
Open **Observe** › **Request Logs**, then **Outgoing Request Logs**. The same filters apply. Each row shows the **Method** (**CUSTOM** for calls that don't map to a standard verb), **Status**, **URL**, **Response Time** (ms), and **When**.
Request Logs don't record traffic that doesn't pass through Qore. Reference: [Request Logs](/control-center/observe/request-logs.md).
### See database operations
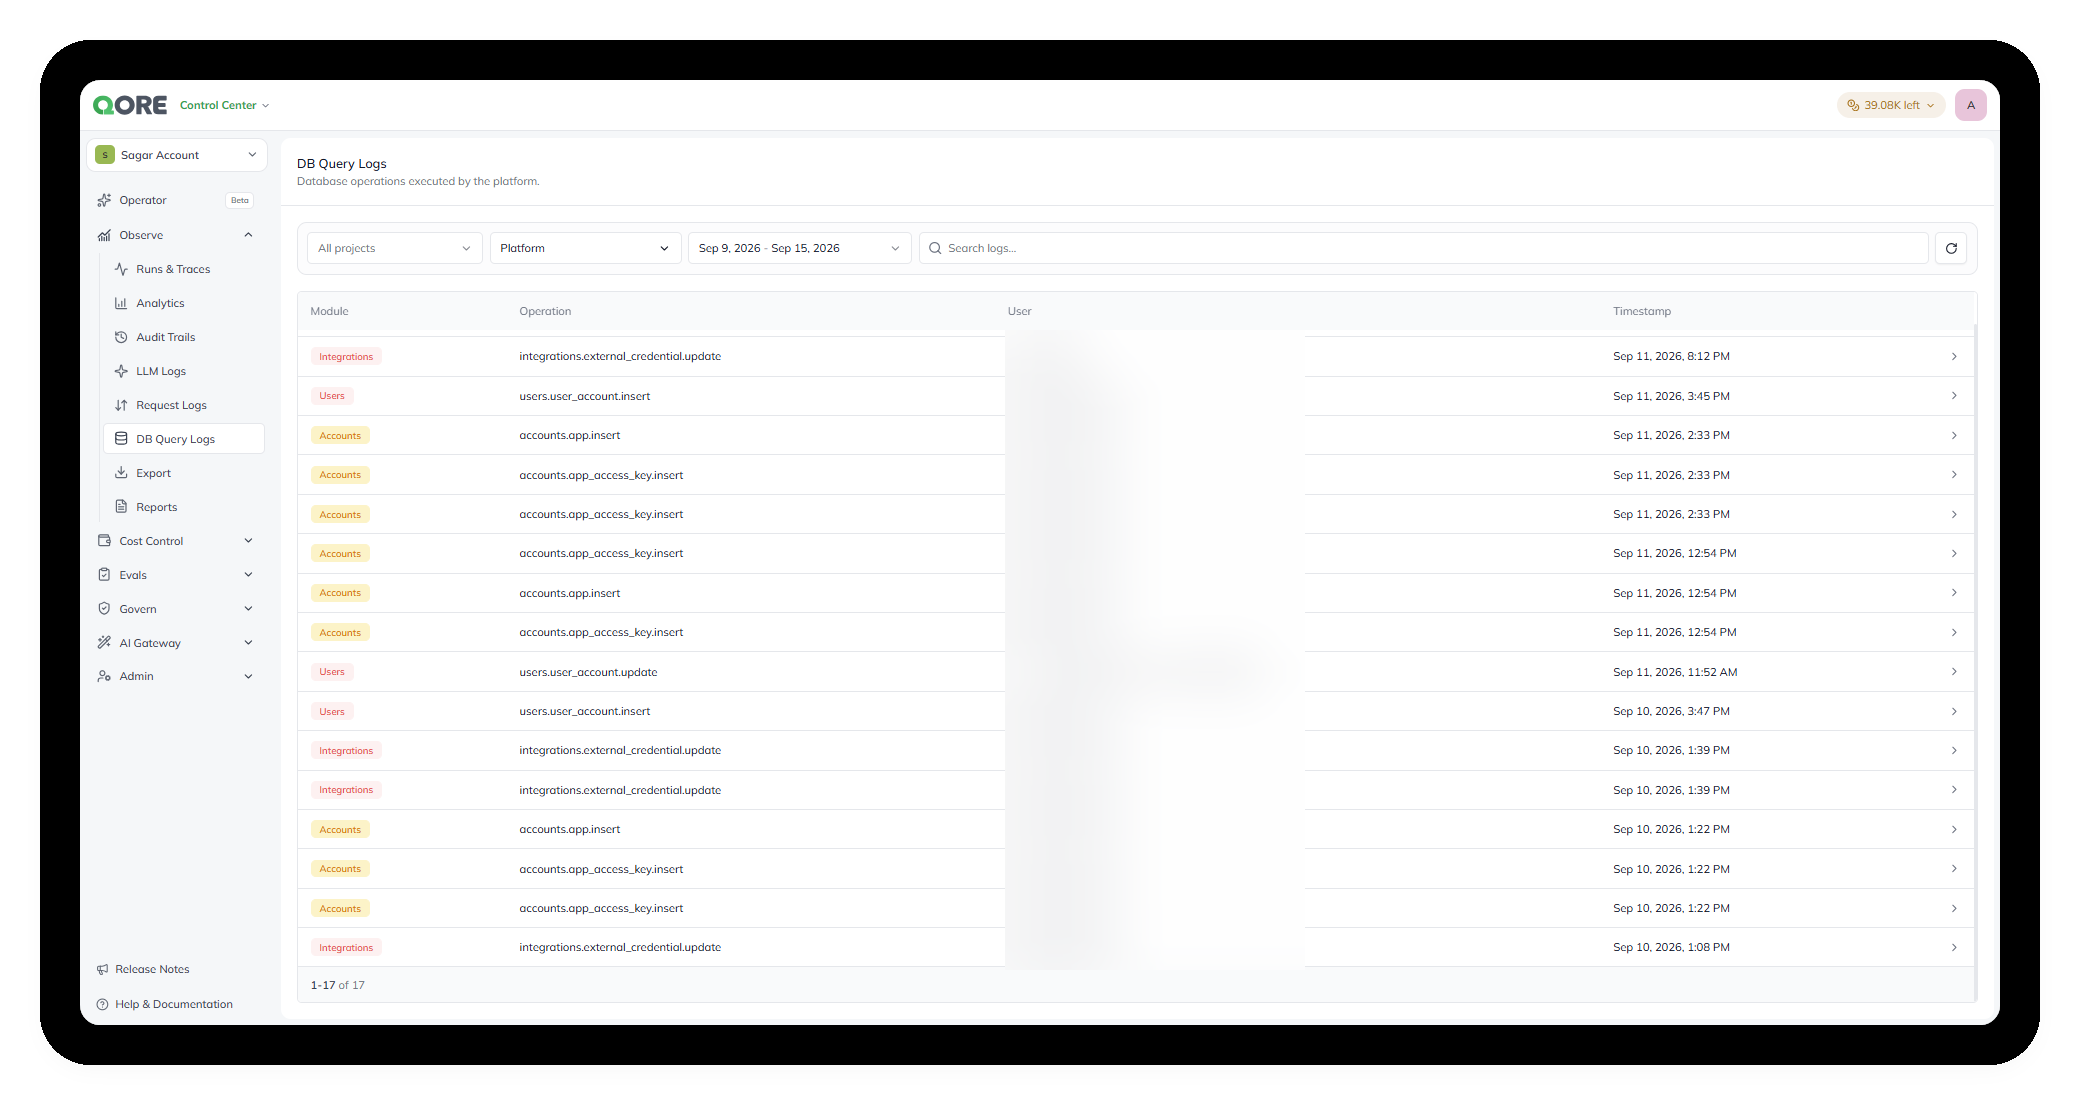
Open **Observe** › **DB Query Logs**. Narrow by project and module, and search the log. Each row shows the **Module**, the **Operation** in `schema.table.action` form (such as `agents.agent.update`), the **User**, and the **Timestamp**.
DB Query Logs.
Reference: [DB Query Logs](/control-center/observe/db-query-logs.md).
***
## :file-export: Export and reports
### Export activity data
{% stepper %}
{% step %}
#### Open Export
Open **Observe** › **Export** and start a new export. Exports run in the background.
{% endstep %}
{% step %}
#### Name and scope it
Give it a name, such as `Weekly audit trail export`. Choose every project (`All projects`, the default) or one project.
{% endstep %}
{% step %}
#### Choose the datasets
Select at least one: **Credit Usage**, **Platform Analytics**, **App Analytics**, **Agent Analytics**, **Audit Trails**, **AI Gateway Logs**, or **Eval Results**. Each dataset becomes its own file.
{% endstep %}
{% step %}
#### Choose the format and delivery
* **Format** — CSV (default), JSON, or PDF.
* **Email** (default) — comma-separated recipients; leave it empty to send to your signed-in account.
* **Webhook** — an HTTPS URL that receives a `POST` with the download link, and an optional signing secret.
{% endstep %}
{% step %}
#### Choose when it runs
* **Scheduled** (default) — hourly, daily, weekly, or monthly. Daily is the default, at `02:00` UTC; weekly runs start on Monday, monthly on the first.
* **One-time** — starts immediately, for `Today`, `Yesterday`, `Last 7 days`, `Last 30 days`, `This Week`, `This Month`, or `Last Month`.
{% endstep %}
{% step %}
#### Confirm
Review the summary, such as `Weekly at 08:00 UTC · All projects · 1 dataset · Csv → Email`, then save or run it.
{% endstep %}
{% endstepper %}
All times are UTC. Reference: [Export](/control-center/observe/export.md).
### Track and update exports
* **Exports** tab — saved definitions, with their project, datasets, mode, format, delivery, next run, last run, and status. Update a definition to change future runs.
* **History** tab — completed runs, with the requested time, project, datasets, delivery, format, row total, and status.
If an email or webhook doesn't arrive, retrieve the file from the history while its link is still valid.
Export, History tab.
### Review a usage or execution report
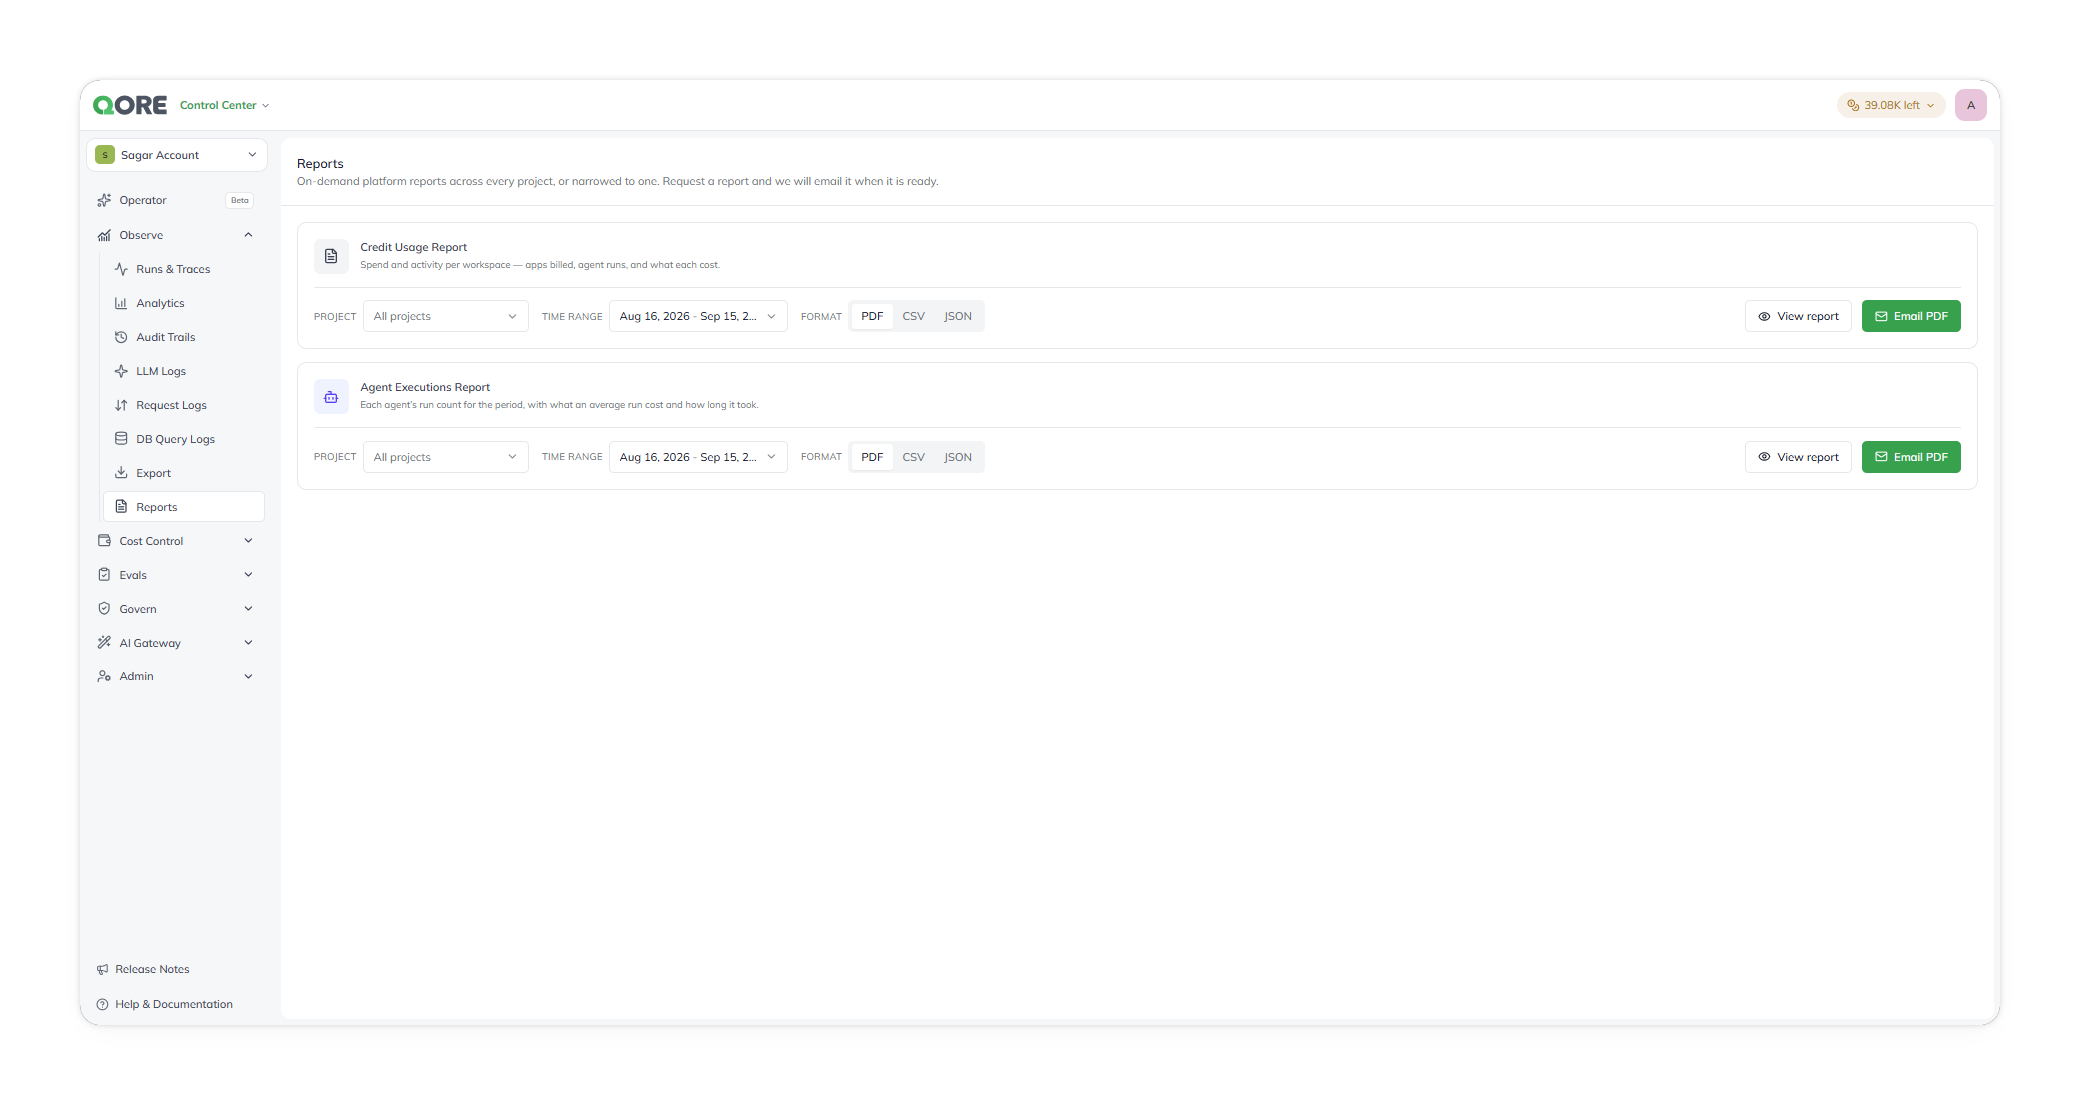
Open **Observe** › **Reports**. There are two fixed reports:
* **Credit Usage Report** — spend and activity per project: apps billed, agent runs, and their cost.
* **Agent Executions Report** — each agent's run count, average cost, and average duration.
For a report, choose the project scope (**All projects** by default), the date range (**This Month** by default, or a preset), and generate it. Results appear as a table.
Reports.
### Email a report
Choose the project scope, date range, and delivery format (**PDF**, the default, **CSV**, or **JSON**), then request the email. The file goes to the signed-in user when it's ready. Reports can't be downloaded from the page or run on a schedule; for scheduled files, use [Export](#export-activity-data).
Reference: [Reports](/control-center/observe/reports.md).
***
## :link: Related pages
* [Observe](/control-center/observe.md) and [Control Center](/start-here/control-center.md)
* Costs: [Manage costs and limits](/task-guides/manage-costs-and-limits.md). Quality: [Evaluate agent quality](/task-guides/evaluate-agent-quality.md).
***
{% columns %}
{% column width="83.33333333333334%" %}
Maintained by Abhishek Paul AI-assisted, human-approved
{% endcolumn %}
{% endcolumns %}
---
# Agent Instructions
This documentation is published with GitBook. GitBook is the documentation platform designed so that both humans and AI agents can read, navigate, and reason over technical content effectively. Learn more at gitbook.com.
## Querying This Documentation
If you need additional information that is not directly available in this page, you can query the documentation dynamically by asking a question.
Perform an HTTP GET request on the current page URL with the `ask` query parameter, and the optional `goal` query parameter:
```
GET https://docs.uptiq.ai/task-guides/monitor-activity.md?ask=&goal=
```
`ask` is the immediate question: it should be specific, self-contained, and written in natural language.
`goal` is optional and describes the broader end goal you are ultimately trying to accomplish on behalf of the user. GitBook uses it to tailor the answer towards what is most useful for that goal.
The response will contain a direct answer to the question and relevant excerpts and sources from the documentation.
Use this mechanism when the answer is not explicitly present in the current page, you need clarification or additional context, or you want to retrieve related documentation sections.